Sales 360 gives sales directors and CEOs their forecast, pipeline, accounts and orders on a phone. I designed it end to end for Boston Technology Corporation around one idea: the quarter's target as a mountain that fills with revenue.
A sales director between meetings wants to know one thing: are we on track for the quarter? Boston Technology Corporation built Sales 360 for directors and CEOs, on IBM MobileFirst and SAP Mobile Platform, collating data from CRMs, ERPs and other backend systems.
Those systems produce plenty of data and very little clarity. Lists of opportunities, purchases and orders answer the director's question slowly. Enterprise apps also rarely make the answer pleasant to read, so the numbers stay in the report.
Could a sales forecast be simple enough to read at a glance on a phone, and personal enough that each user shapes it around their own leads?
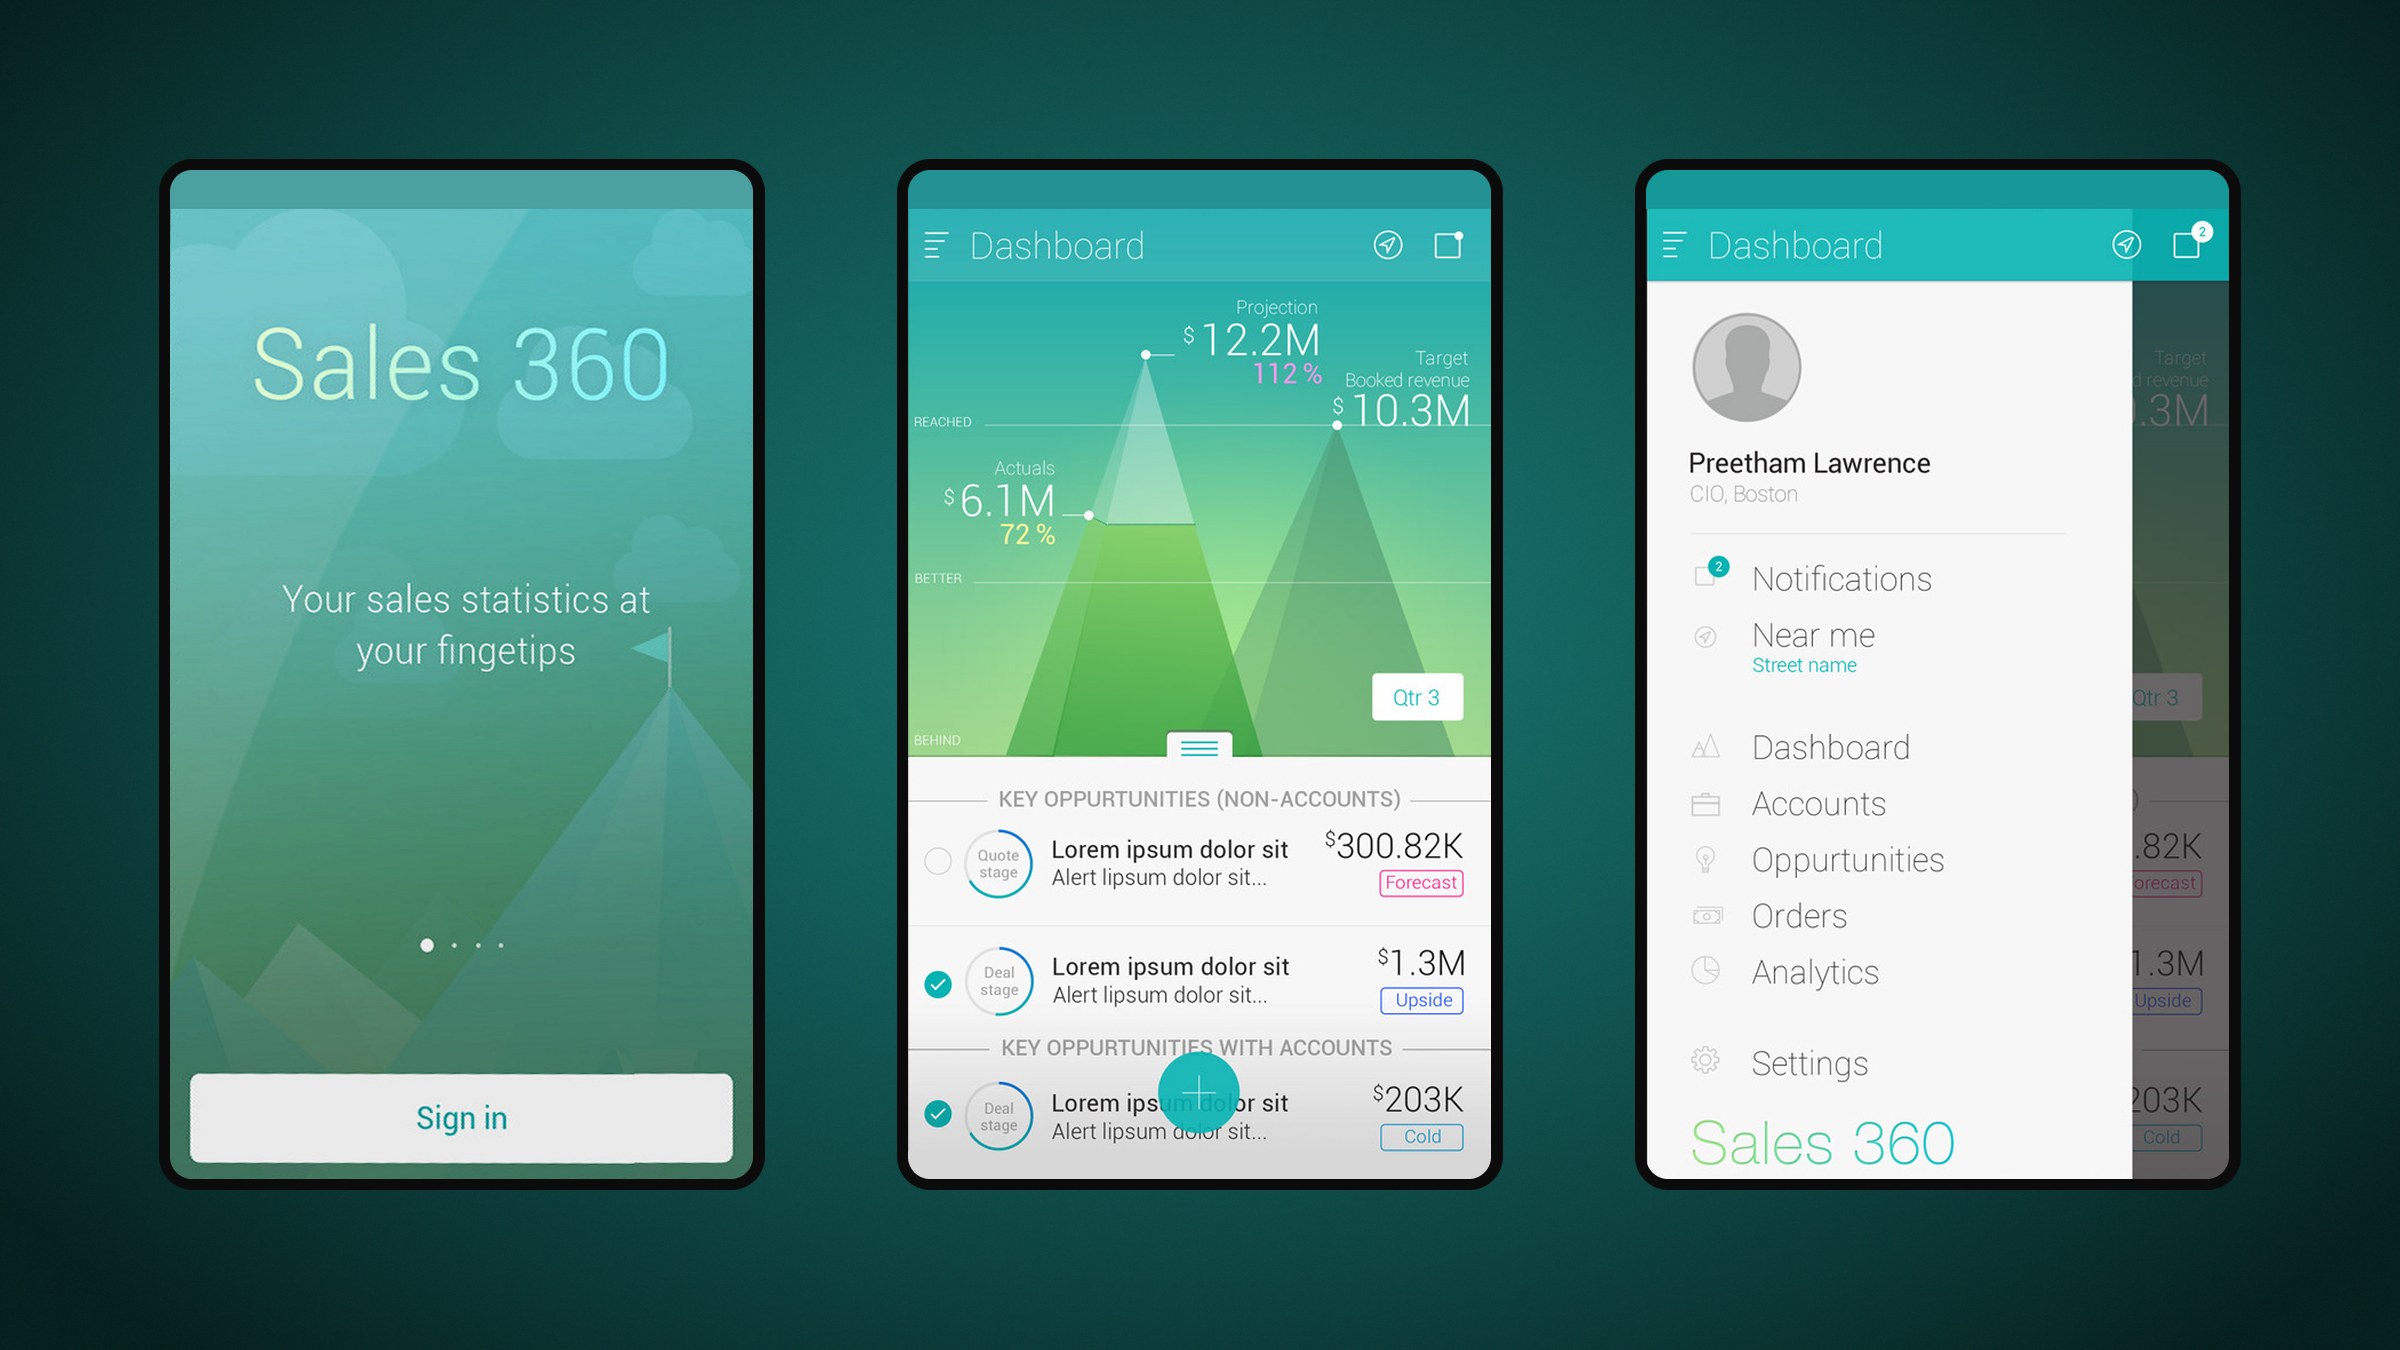
Hearing "target" made me think of climbing a peak. That became the dashboard: a pyramid chart for the target, filling up as the user adds leads and those leads are billed and converted to revenue. Actuals, projection and booked revenue read straight off the peaks. Every other screen follows the same rule, graph first and list second, from accounts on a map to an opportunity timeline and tappable filters.
My role
Lead UX/UI designer. Brought in by Boston Technology Corporation to design the app end to end: the pyramid dashboard concept, navigation, accounts, opportunities, purchases, orders, filters and the app icon.
What made it hard
Enterprise data, executive attention
Users were sales directors and CEOs checking progress between meetings, with seconds to spare.
Two platforms, one experience
The app had versions on IBM MobileFirst and SAP Mobile Platform, fed from diverse CRMs and ERPs.
Personal forecasts
Each user needed to build their own dashboard from the leads that mattered to them.
Fast input on a small screen
Filtering by status, stage, probability and closing quarter had to work without typing.
Questions we asked
What is the one number a sales director checks first?
Can a chart show progress toward a target without a legend?
When does a map beat a list for finding accounts?
How do we show an opportunity's history in one control?
01
Target as a mountain
The dashboard shows the quarter as peaks: actuals, projection and booked revenue against target. Users add leads to the dashboard, and the pyramid fills and inches toward the target as those leads turn into revenue, ending in a congratulations state. A swipe or the brand icon opens the sidebar for profile, notifications, accounts near me, opportunities, orders, analytics and settings.
Onboarding, the pyramid dashboard and the sidebar make up the first run.
02
Adding and drilling down
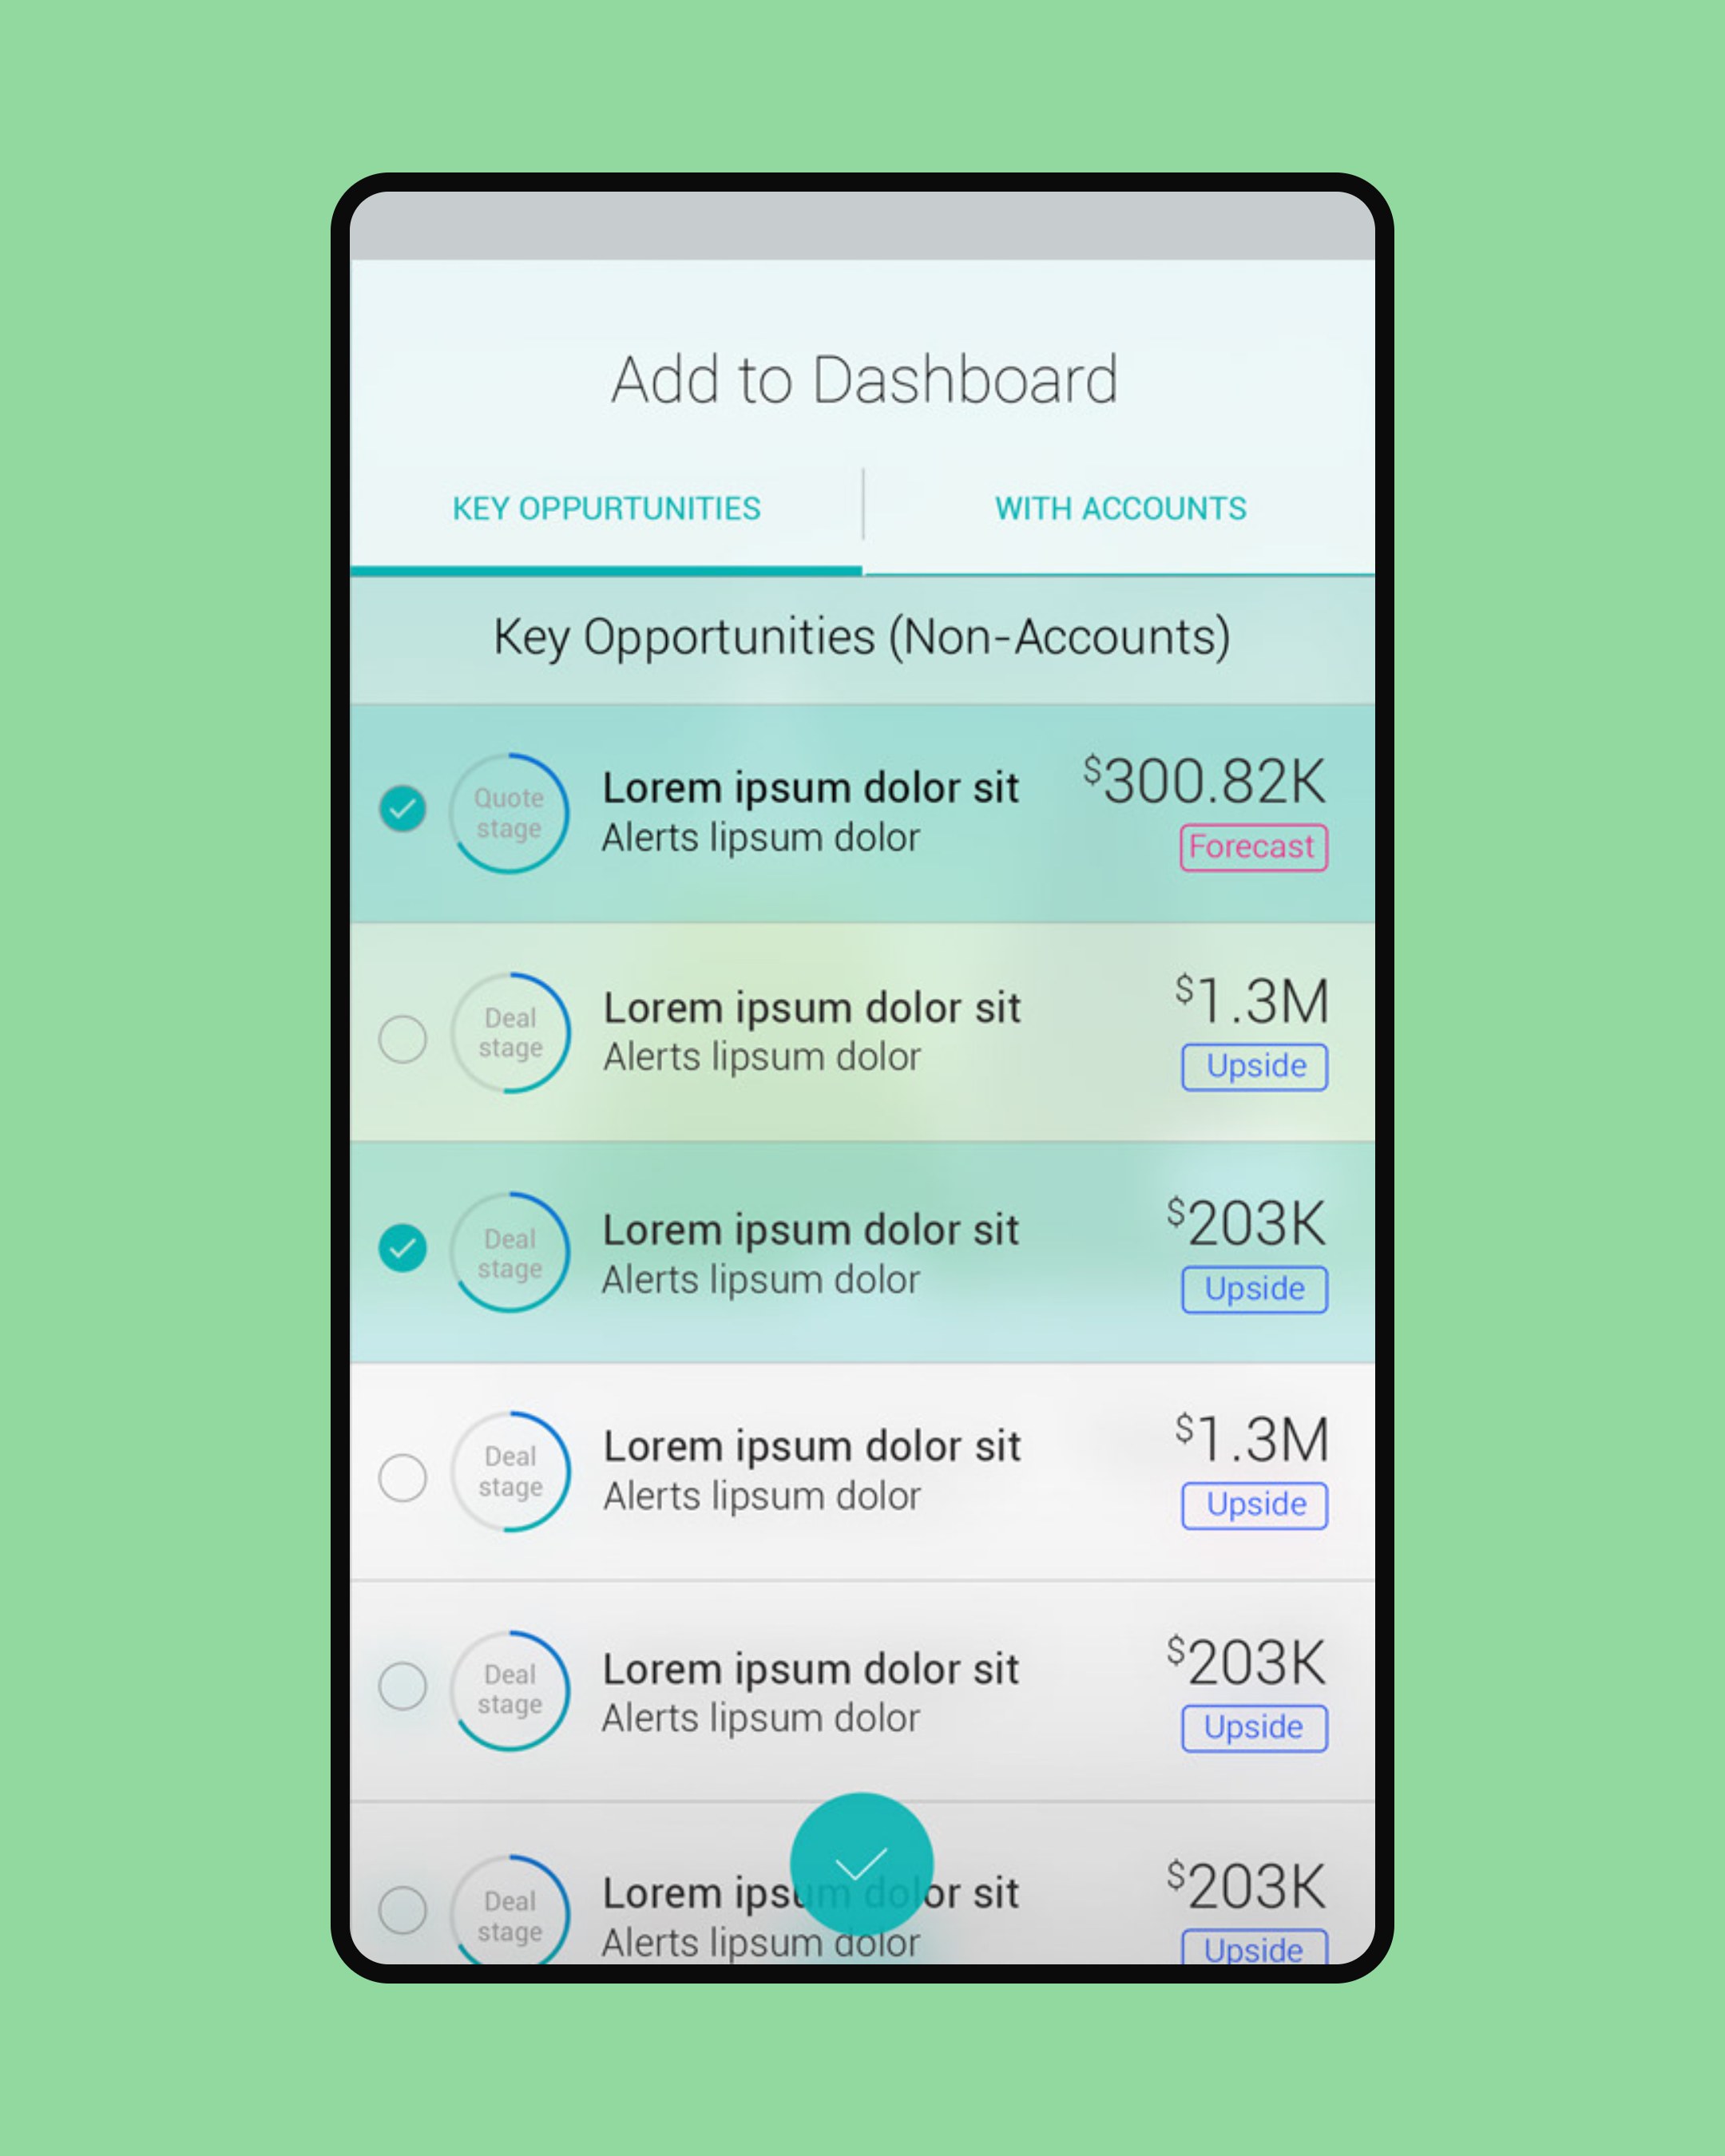
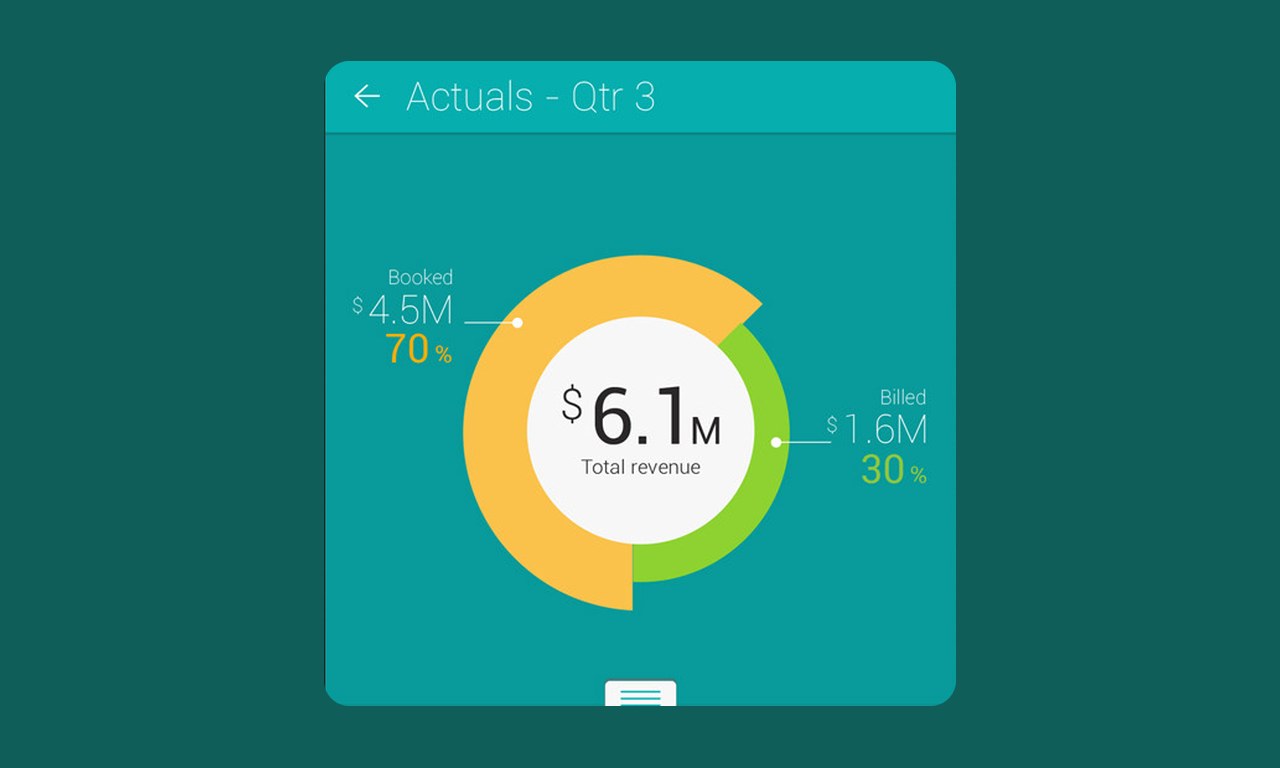
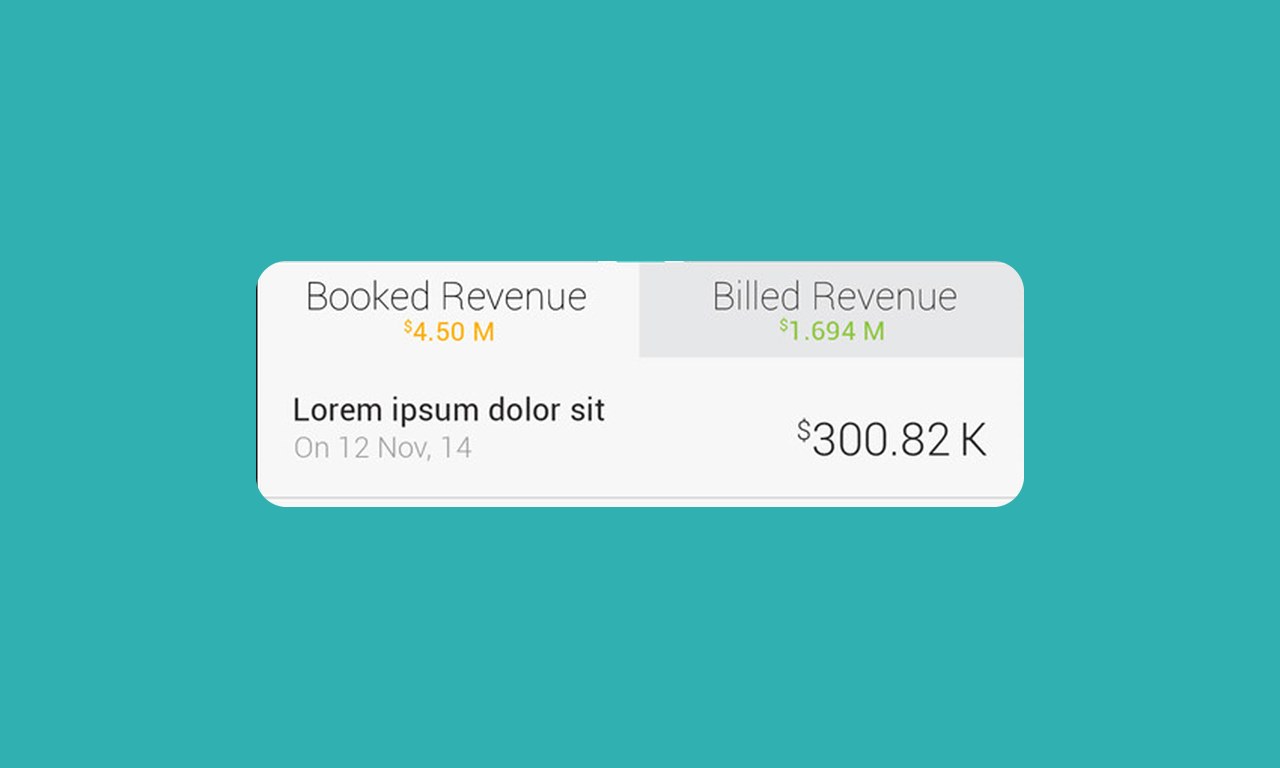
A plain overlay adds leads or opportunities to the dashboard, driven by one action button with three states: add, cancel and confirm. Tapping actuals or projections opens a dual view, graph above and list below, splitting revenue into booked and billed.
One overlay adds leads to the dashboard; tapping actuals opens booked against billed revenue.
03
Accounts, on a list or a map
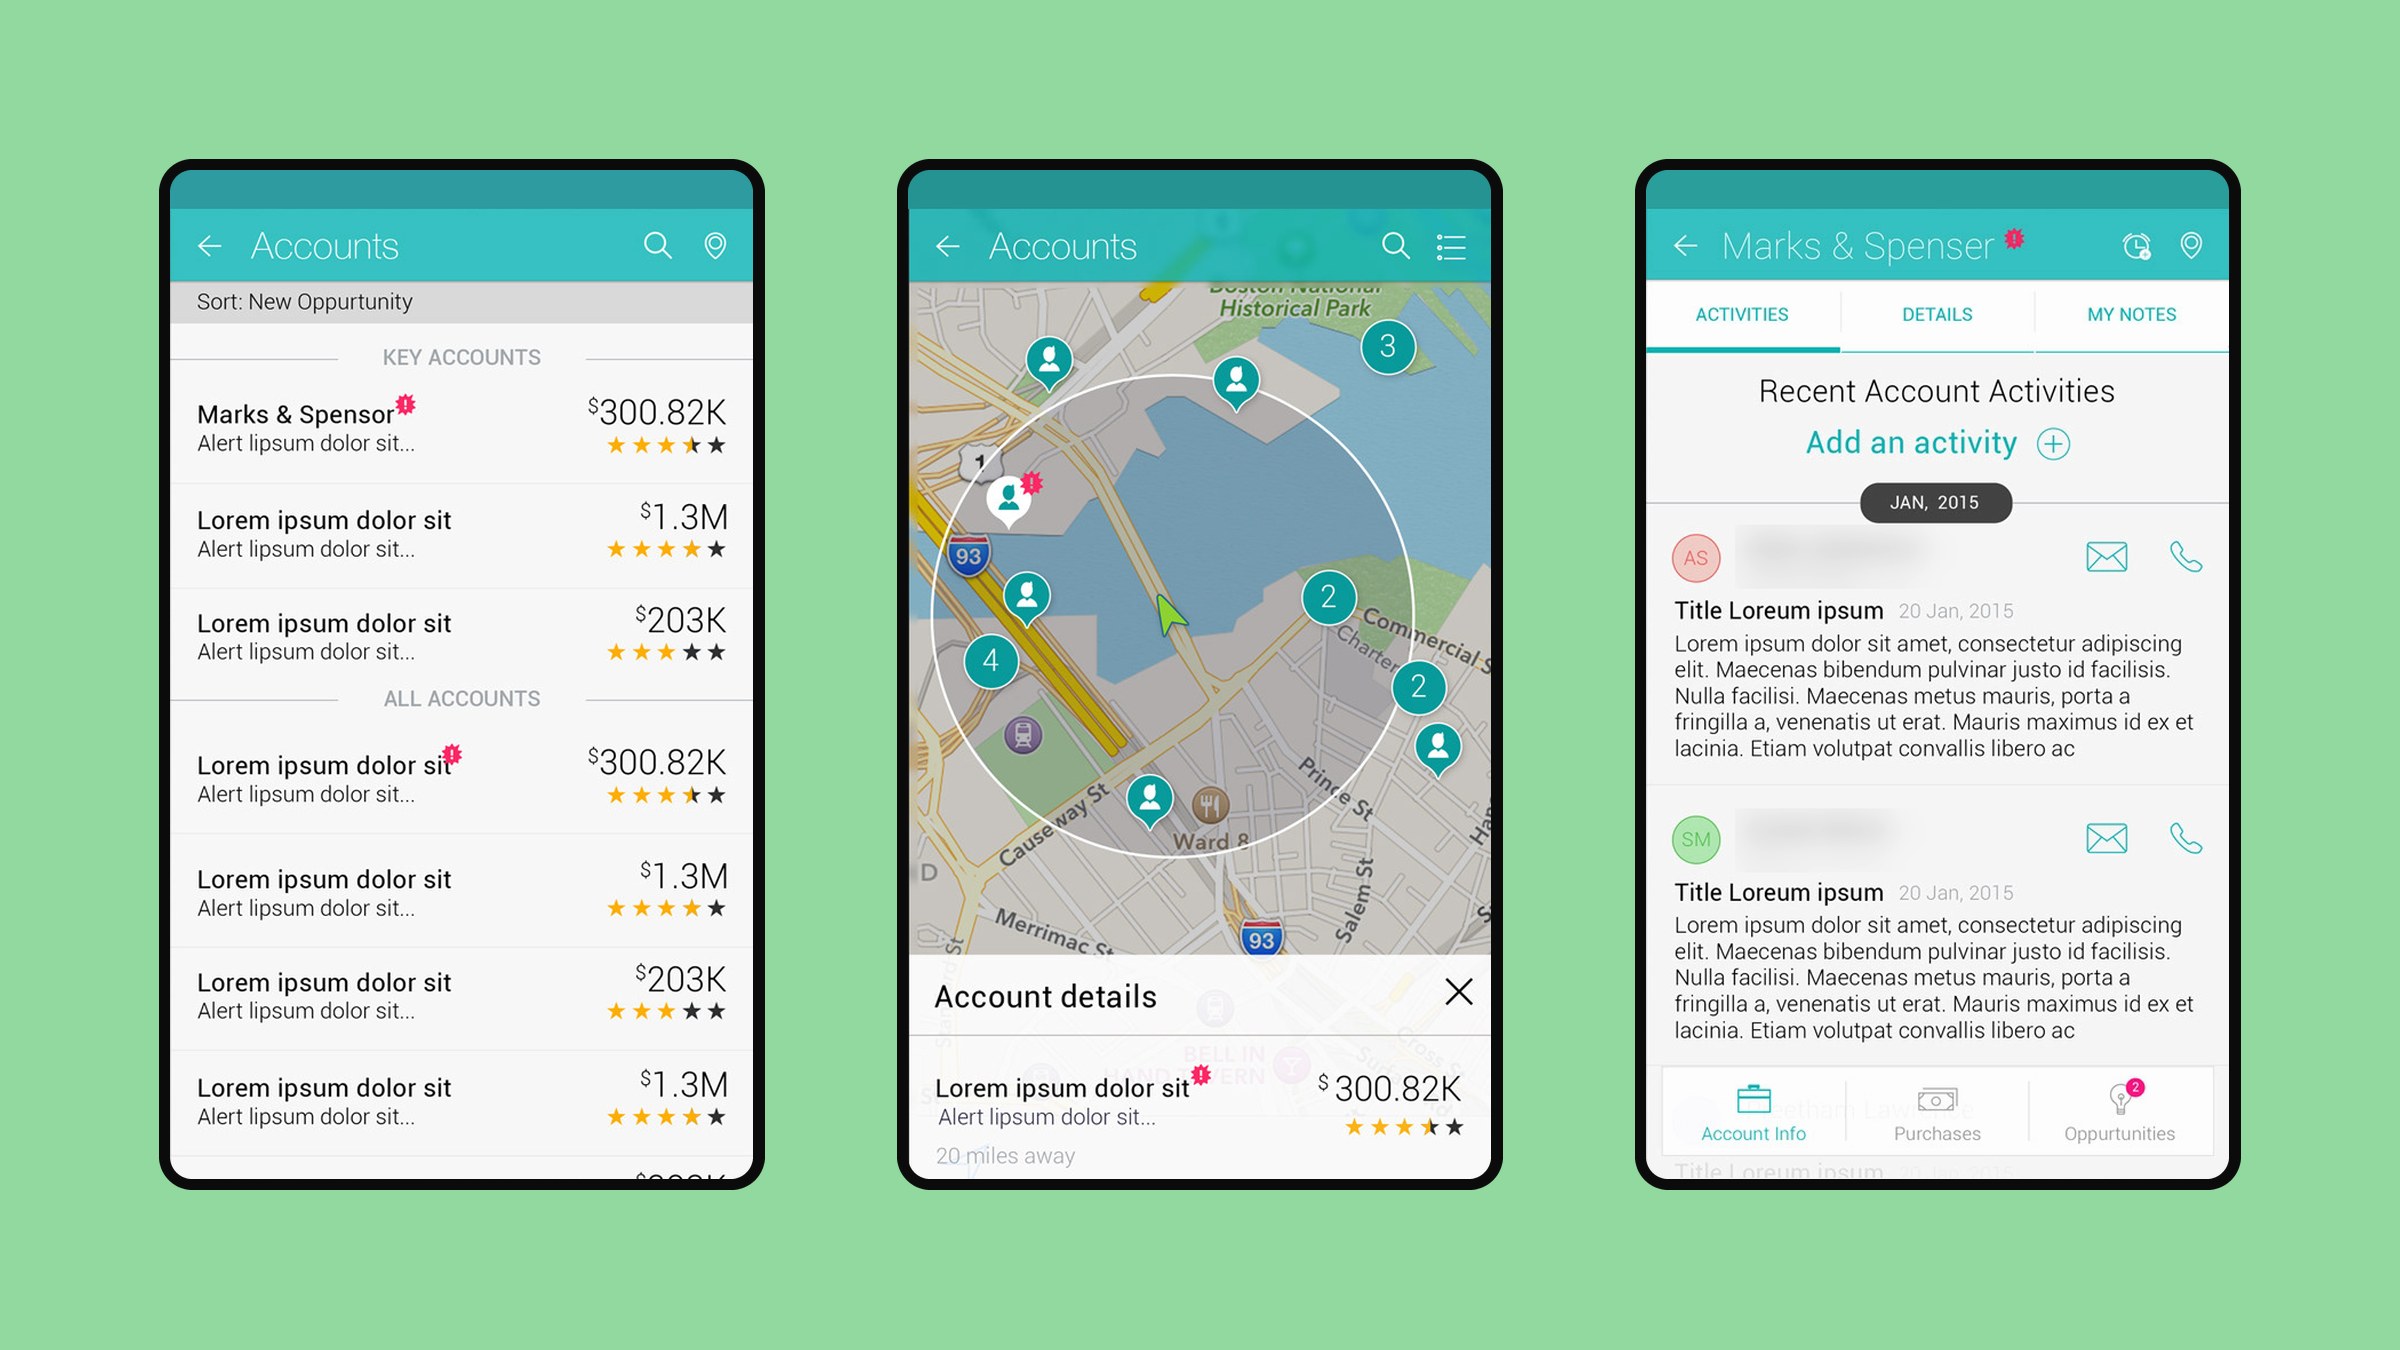
Accounts appear as a simple list with value and rating. One toggle turns the list into a map, so a rep can spot nearby accounts and potential opportunities, marked with a pink pin. Each account opens to its recent activity, so the user knows where to pick up. A details tab puts call and email next to every stakeholder.
List, map and recent activity for every account; sample contact names are blurred.
04
Purchases, opportunities and orders
Purchases and orders use a line and area chart that summarises the quarter before the list begins. Opportunities get their own timeline control that captures each milestone, from deal start to deal sign. The filter screen replaces typing with chips and a probability slider for status, stage, chance of winning and expected closing quarter.
Every list starts with a chart, from the opportunity timeline to orders.
In motion
Outcomes
2enterprise platforms: IBM MobileFirst and SAP
15app screens designed
What I took away
Find one strong metaphor. The mountain made the rest of the product easier to explain.
Keep one rhythm. Graph first, list second gave every screen the same shape.
Enterprise users are people too. They respond to warmth and clarity as much as anyone.