Country and office managers in a global sales organisation live by their numbers. They track sales against goal, this year against last, and how leads move through the pipeline.
Those numbers usually sit in desktop reports. Away from a desk, a manager has no quick way to tell whether an office is ahead, on track or behind, or how one market compares with its neighbours.
What is the smallest set of views that tells a sales manager, in a few seconds, where they stand?
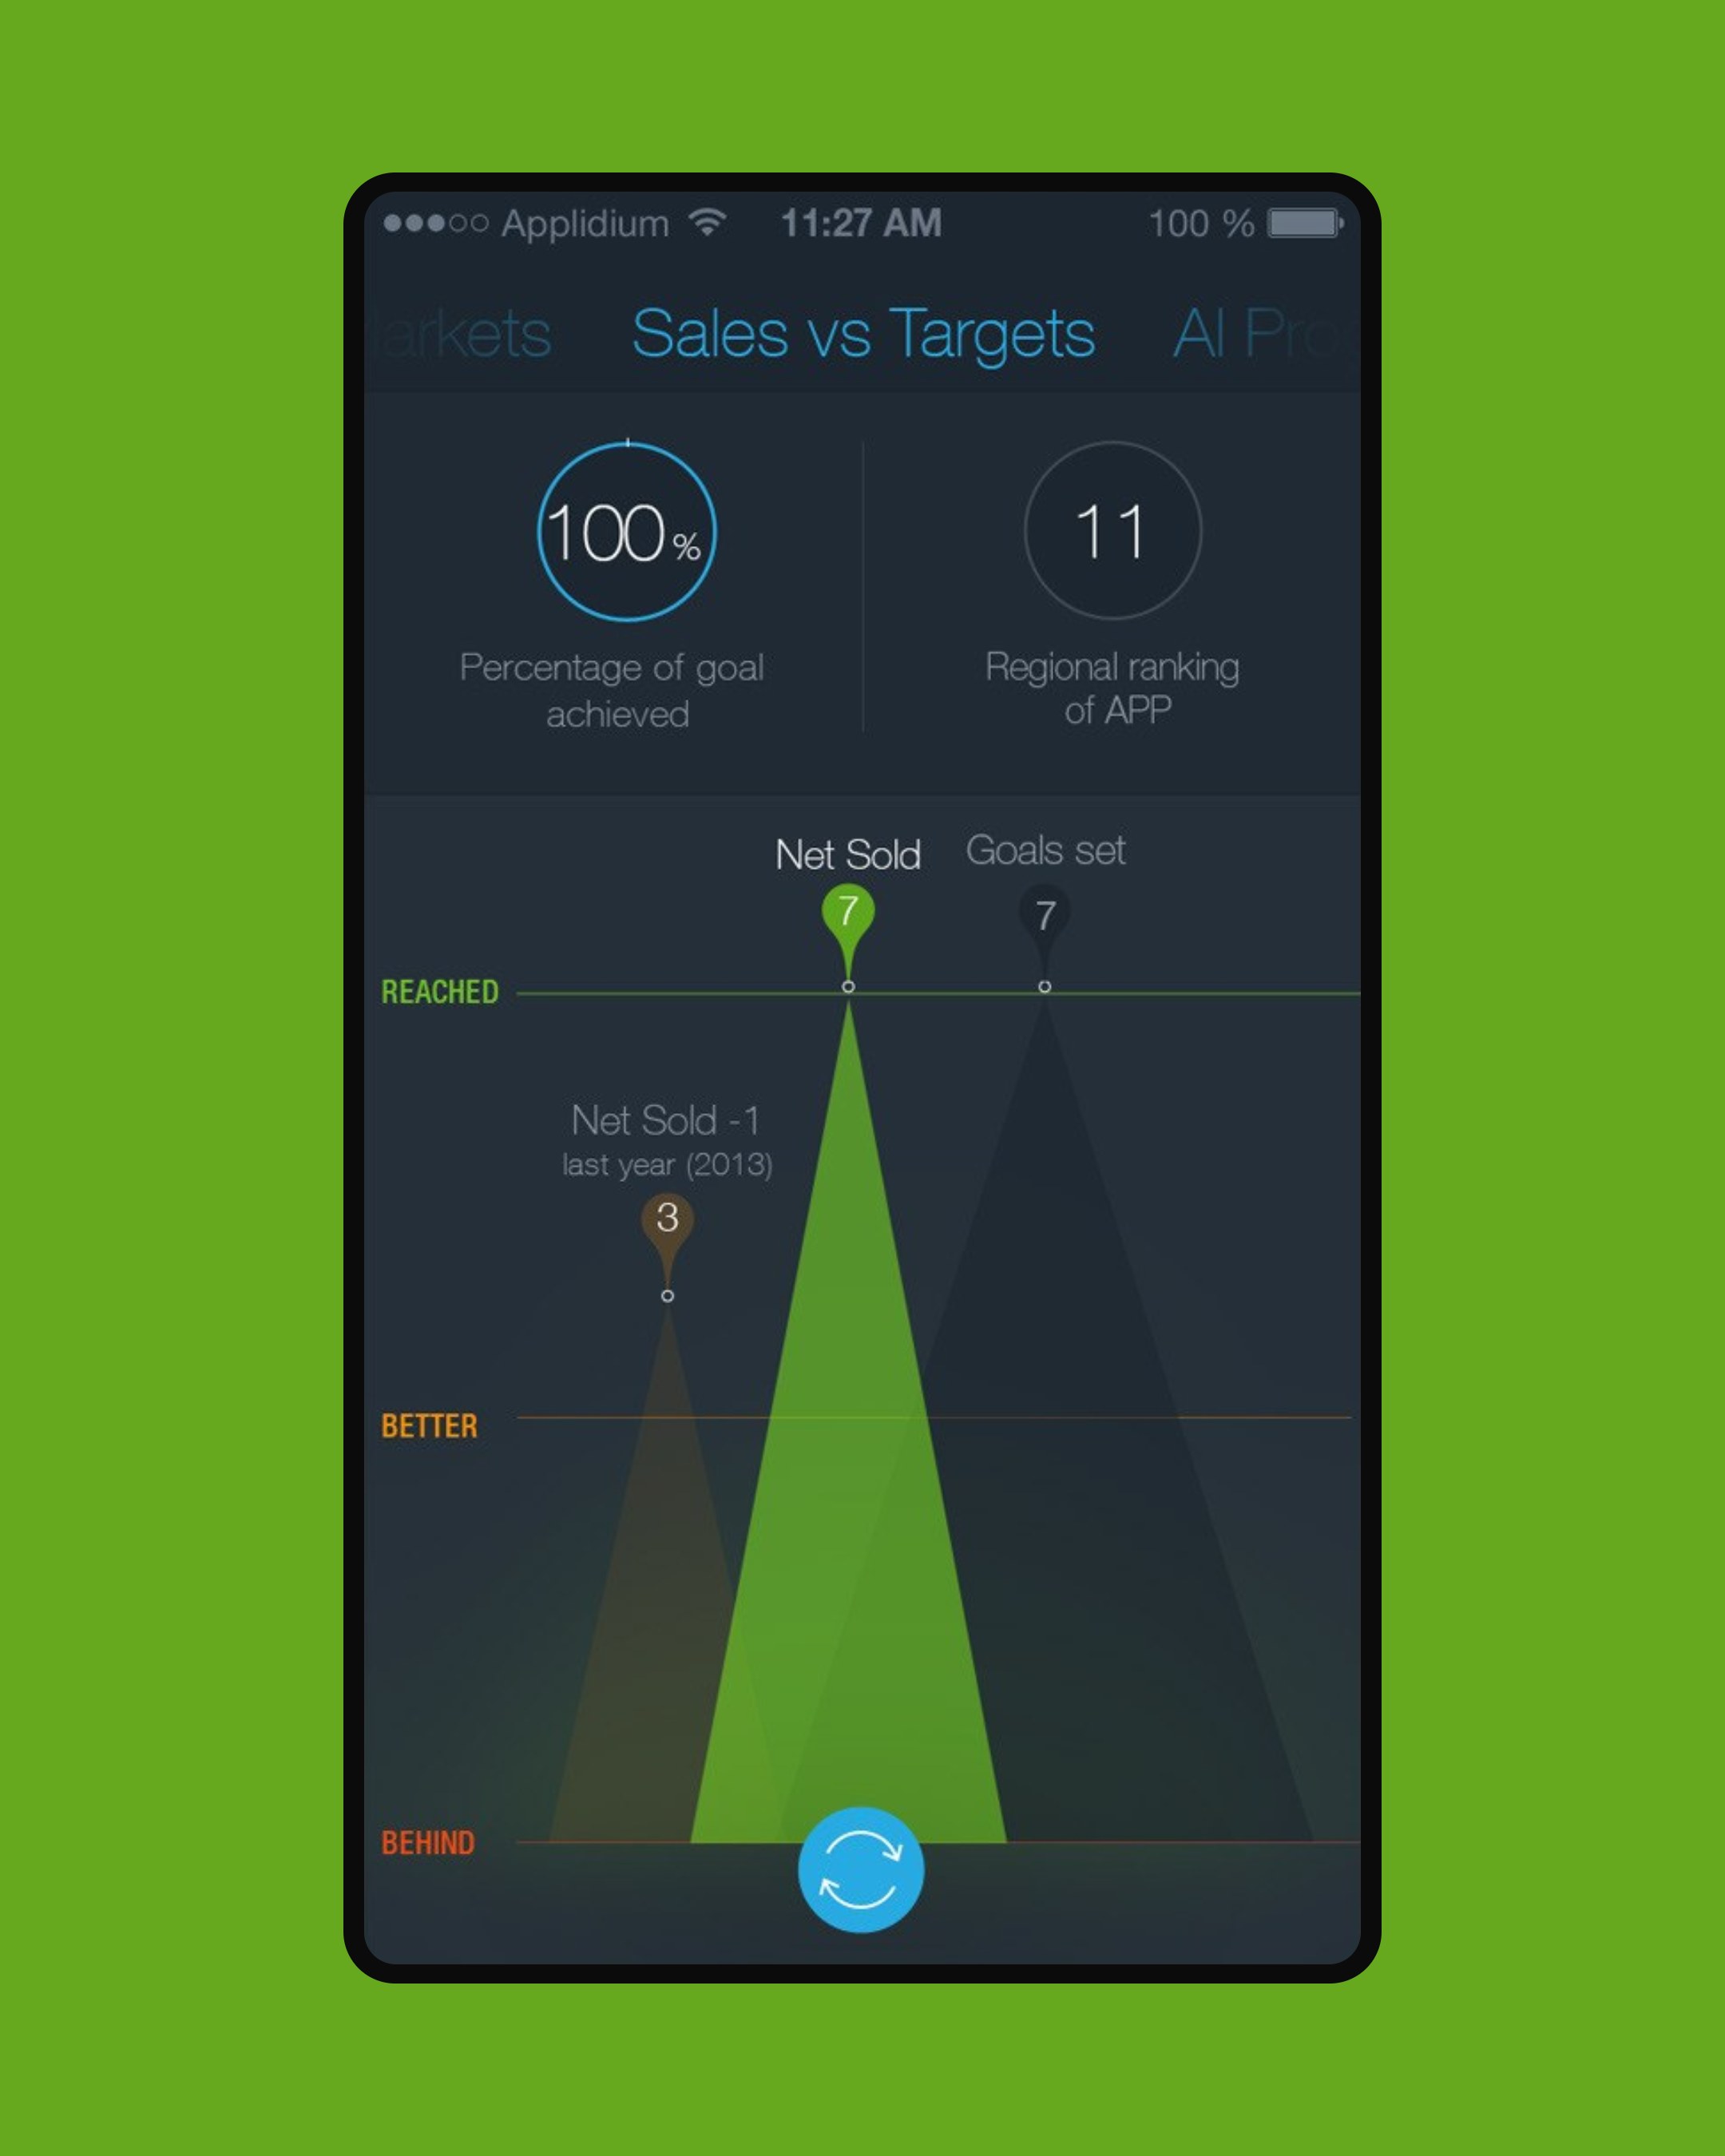
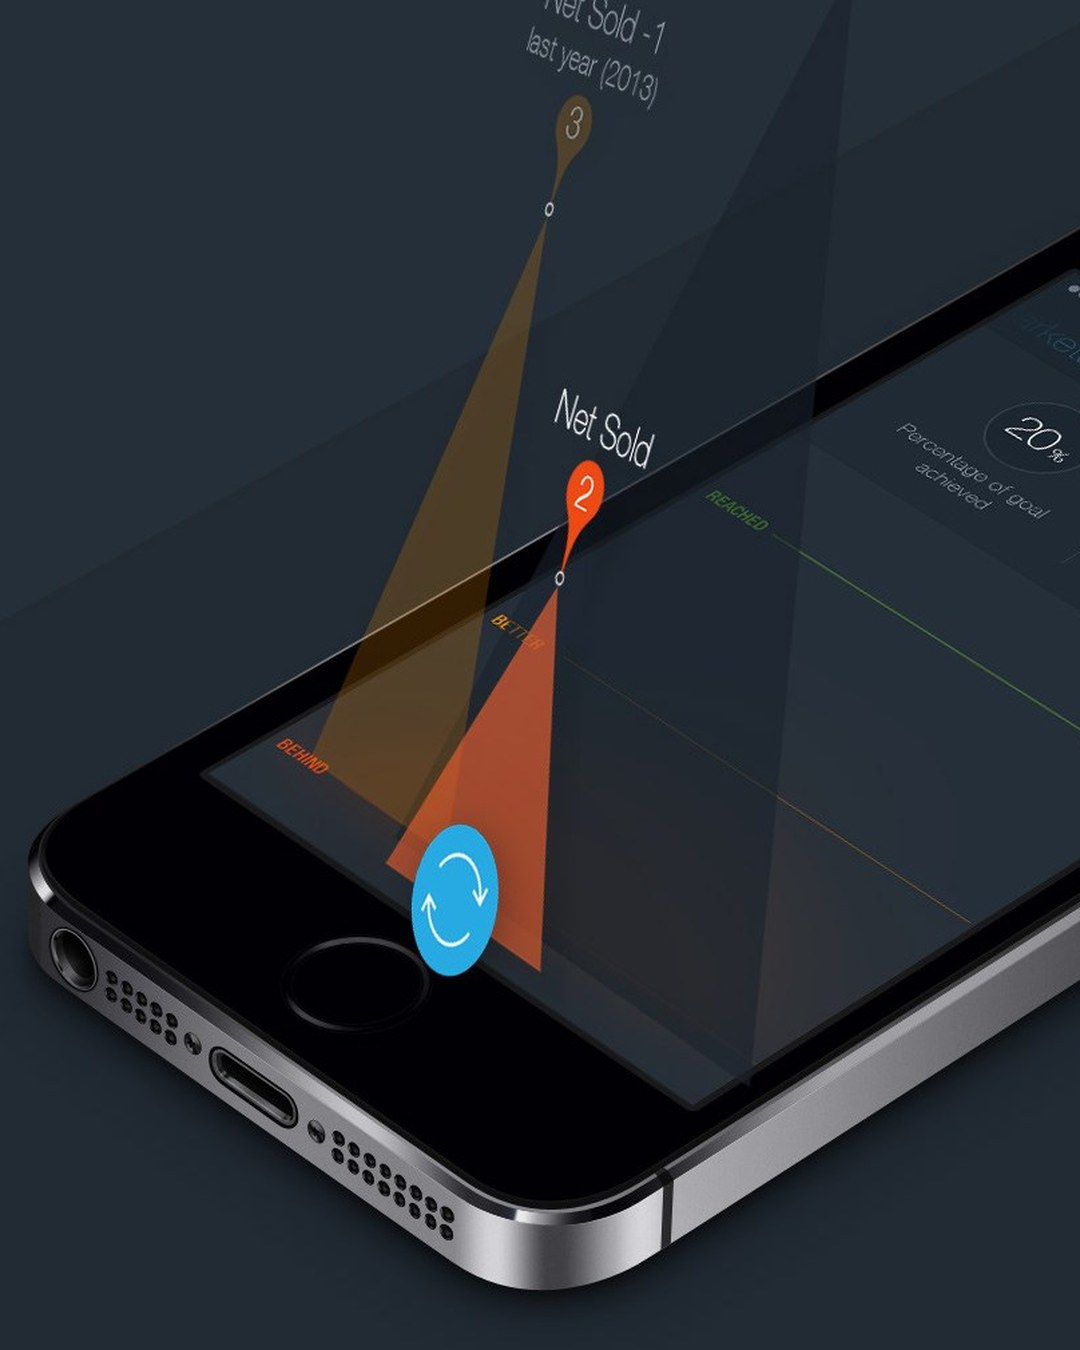
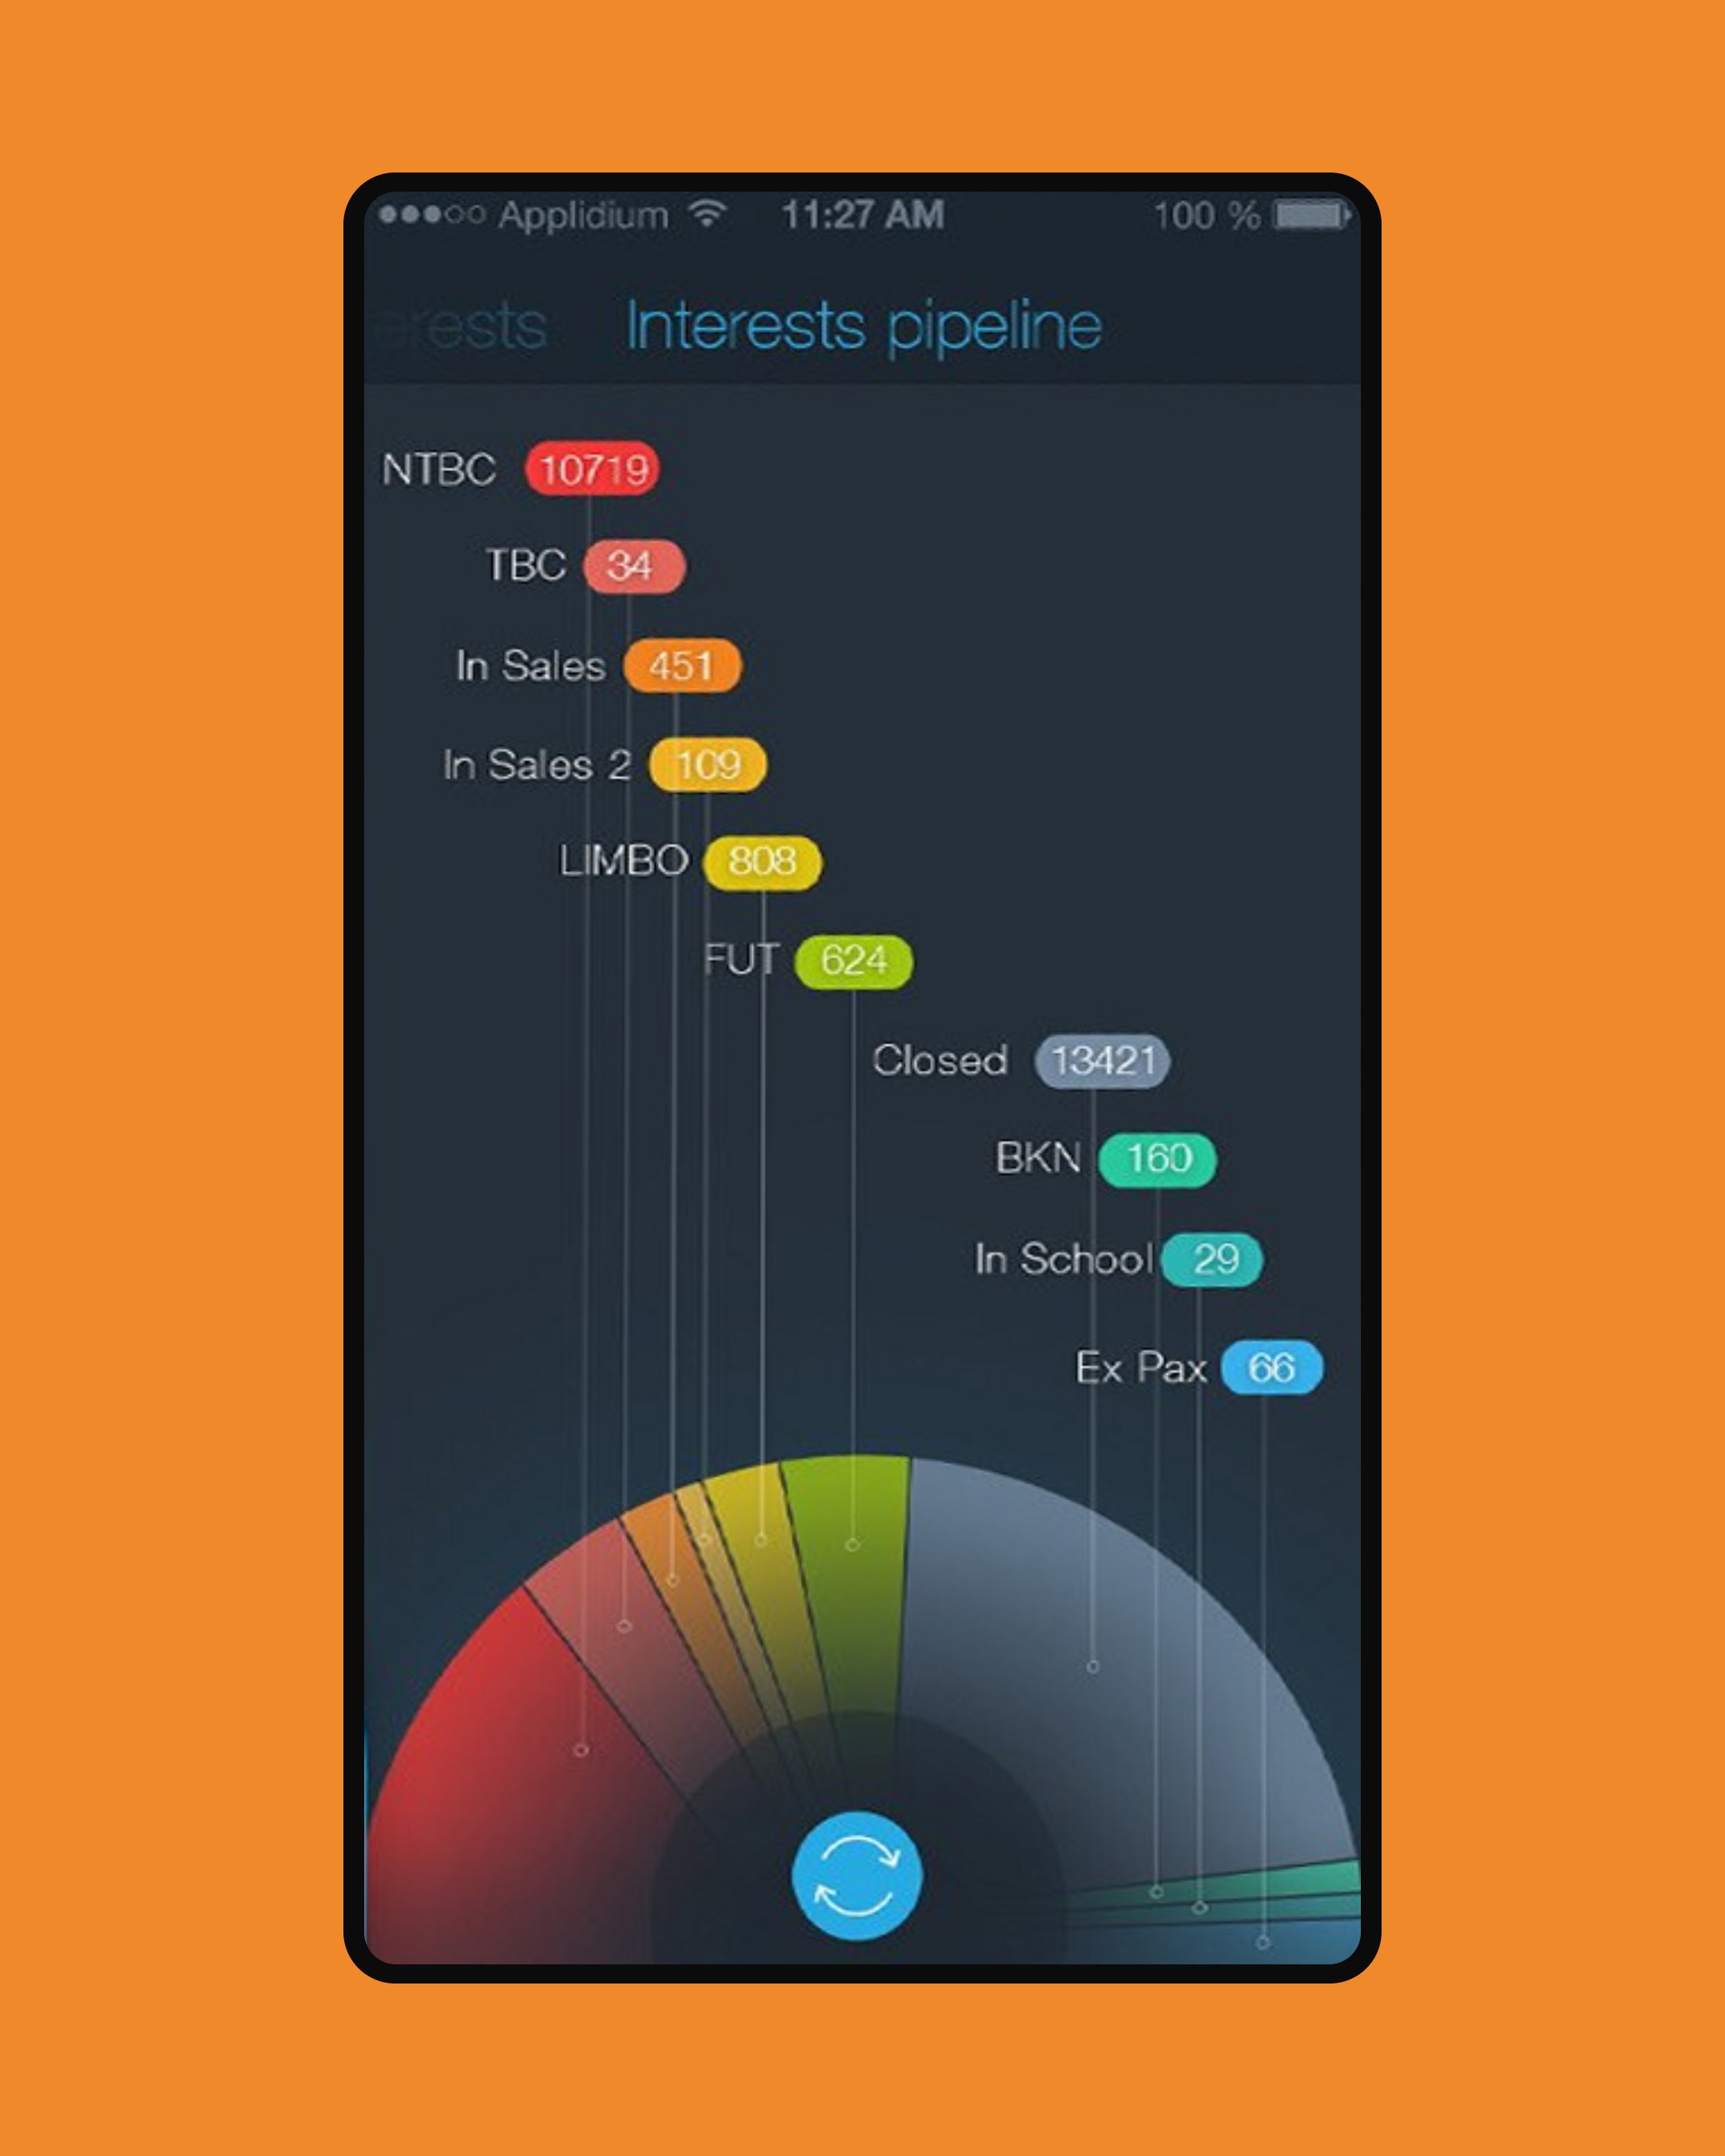
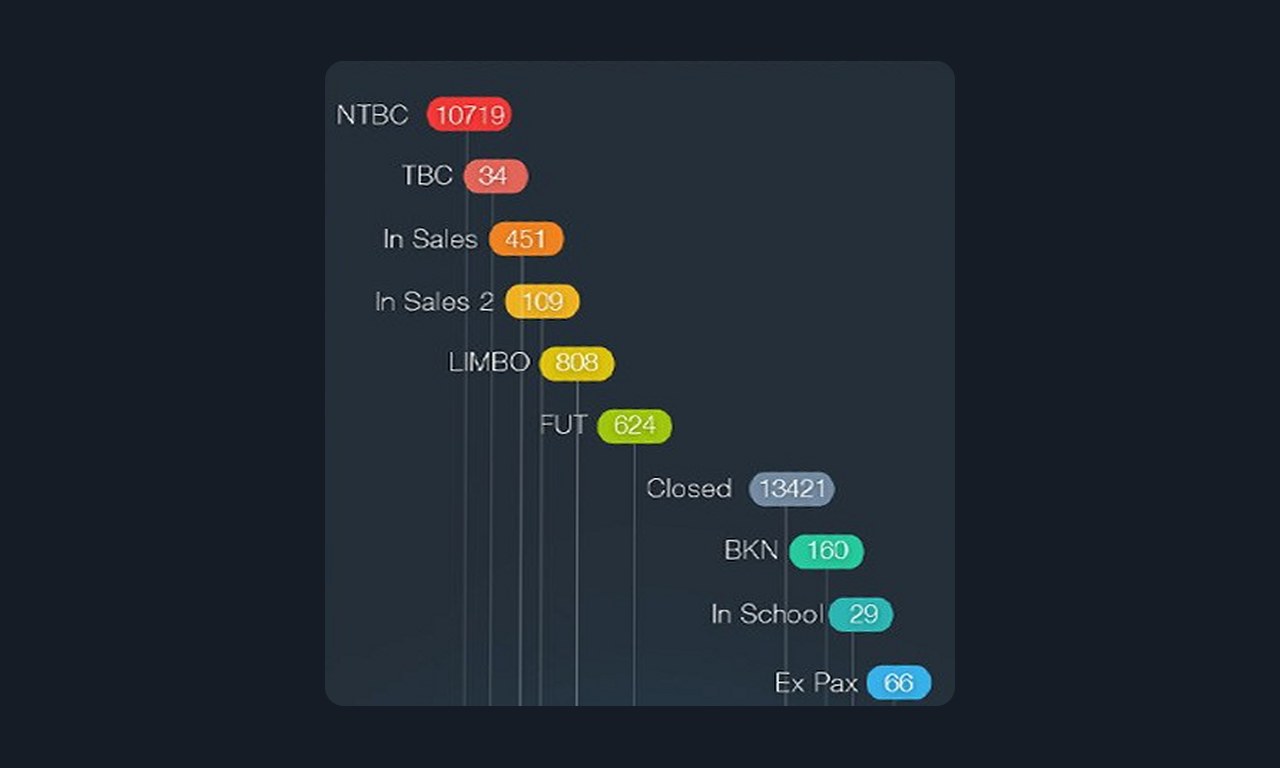
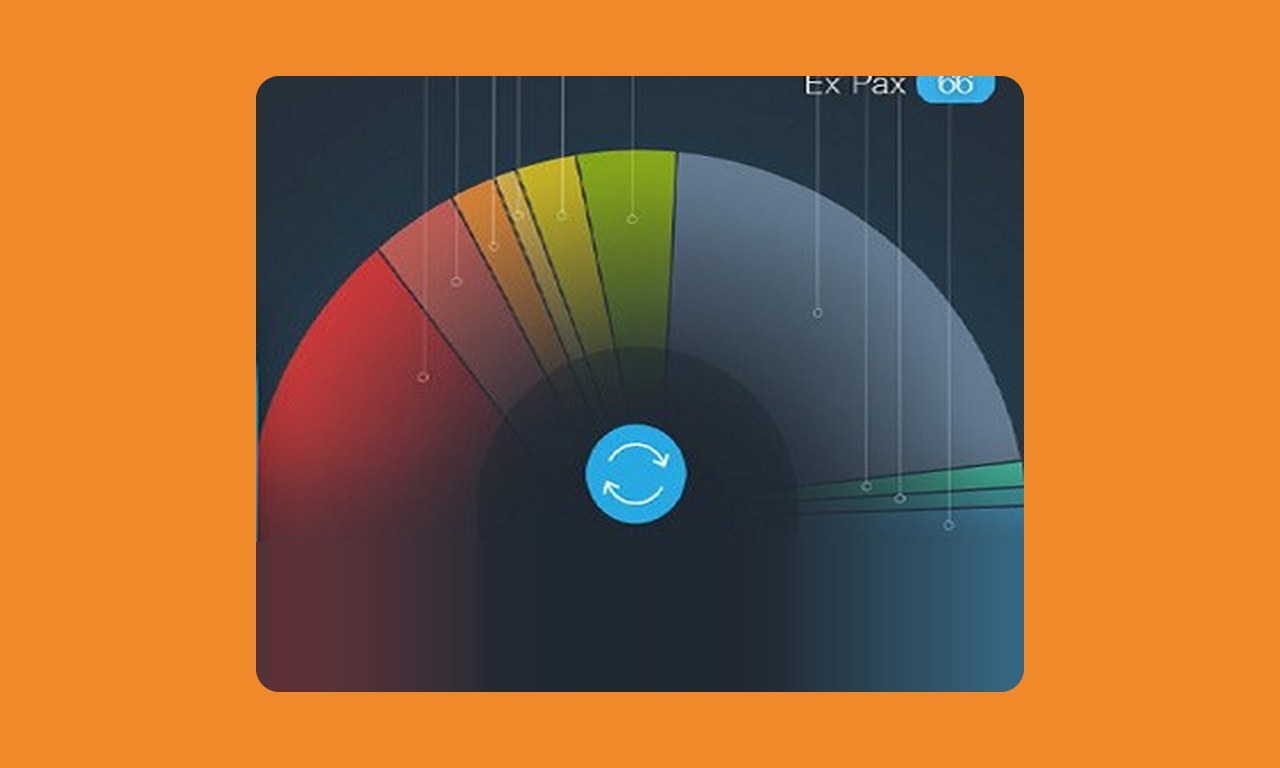
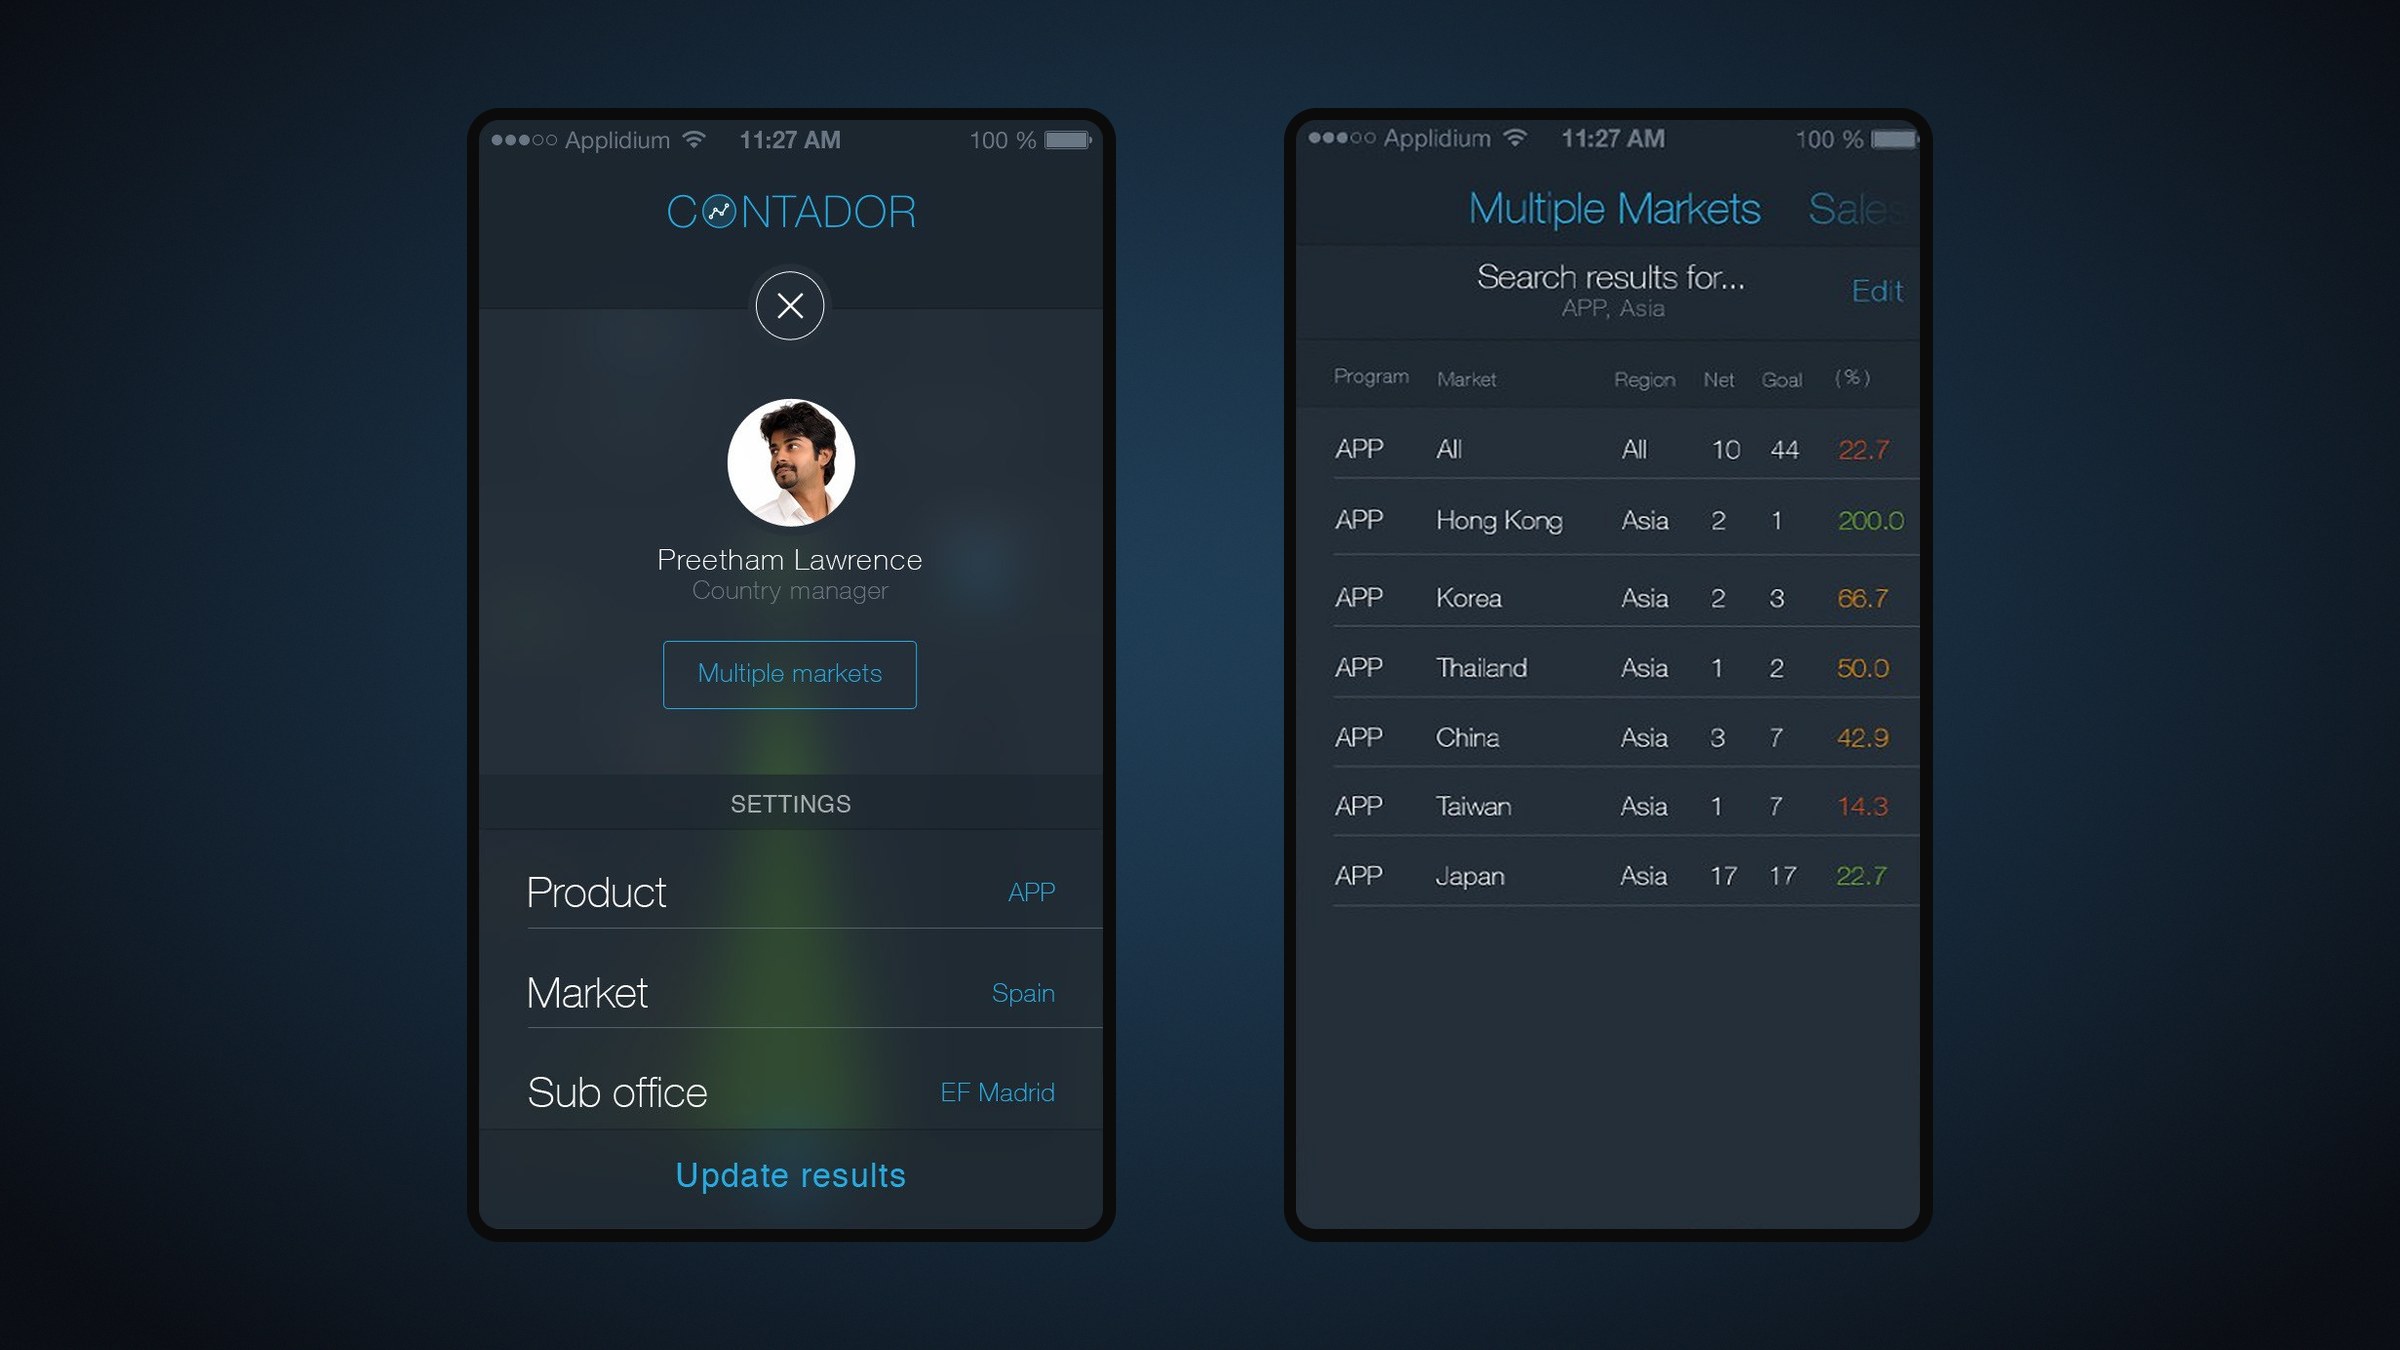
Contador answers with a handful of focused screens. A single chart plots net sold against goal and against last year, on bands marked Reached, Better and Behind. A fan chart shows every stage of the lead pipeline. A table compares markets side by side. Shaking the phone opens the filters for product, market and sub-office.
Creative lead. Designed the app concept, the chart language, the screens and the app icon.