The Digital Experience Kit for dashboards works like a recipe book. ODSU, the design system, supplies the ingredients; the kit gives the recipes. It is one blueprint for every designer at Roche. I co-wrote version 1.0, released in June 2024.
Interaction design, Design frameworks, Design systems
Team
Three co-authors
A Roche customer opens a dashboard as the day's starting point, glances at it on a phone, or reads it on a wall screen across the room. Wherever it runs, it has one job: to show at a glance whether they are on track.
Each product team had to answer the same questions: how big a widget is, what it shows while loading or empty, how users get from an alert to its cause. Answered separately, they cost design and development time, split the experience across Roche products and added cognitive load for customers.
Could one kit answer those questions once, for every Roche dashboard and every screen it runs on?
We wrote the answers down once, as the Digital Experience Kit for Dashboard Applications: a blueprint of interaction rules under Roche's UX standards, built on ODSU. It breaks every dashboard into a page shell, sections and widgets on a 12-column grid. It sets three screen ranges, from phone to wall screen, and routes drill-down through one chain: alert, where, why, action. Version 1.0 came out in June 2024, next to a sibling kit for manually operated instruments.
My role
Principal UX, co-author. Co-wrote version 1.0 of the Digital Experience Kit for Dashboard Applications, a 51-page guide, with a design lead and the subchapter lead for digital design and user testing services. Its sections point to the ODSU, ergonomics and playbook sources behind the rules.
What made it hard
Three kinds of dashboard
Start pages, phone and wall-screen monitoring, and heavy analytics need different depth, so version 1.0 left the analytics-oriented type out of scope.
Phone to wall screen
The same widget had to work on a 320 px phone and on a wall screen read from more than three metres away.
Three ways to build
Teams build dashboards as custom web components, in Tableau or in Superset, and each supports a different share of the patterns.
Structure before style
Version 1.0 settled the structure first. Time ranges, data visualisation, labelling and motion stayed marked as coming soon.
Questions we asked
Can someone across the room tell whether a KPI is on or off track?
Should a widget's size be set in pixels or in grid columns?
What should a widget show while its data loads, or when it has none?
How does a user get from an alert to the action that fixes it?
01
Two kits, one hub
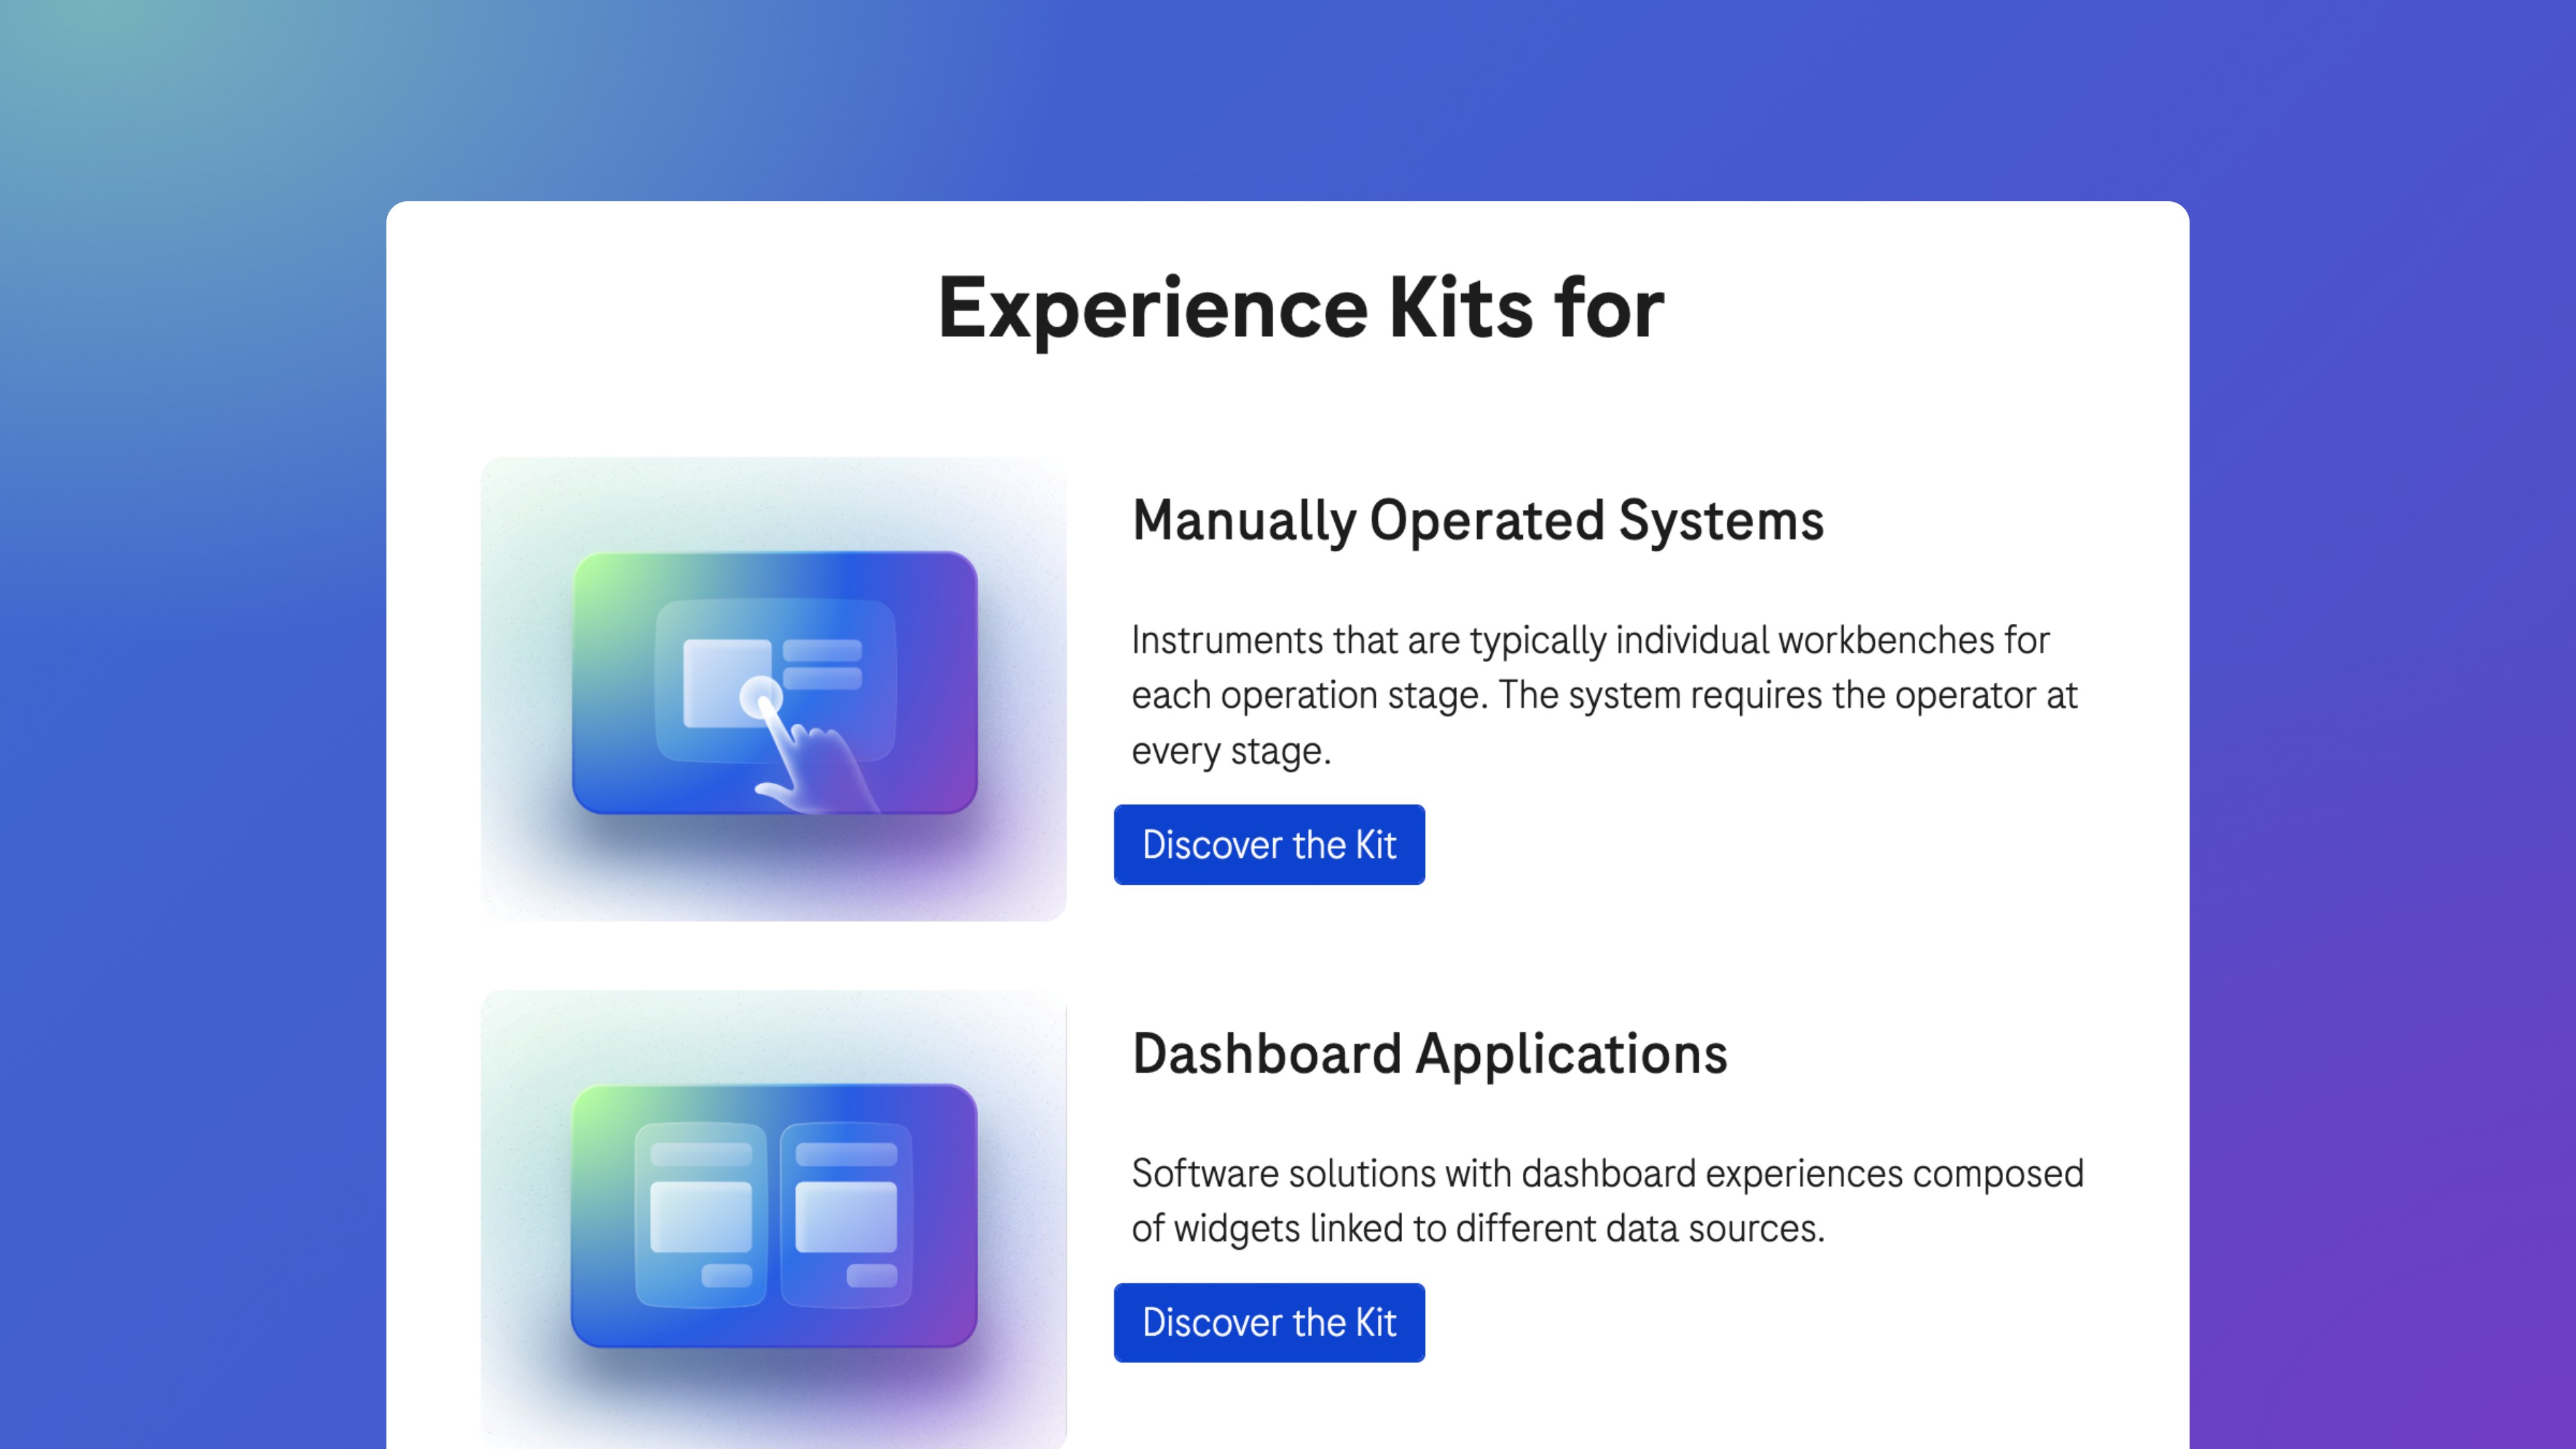
Roche sorts its kits by the kind of product they serve. One covers manually operated systems: instruments with a workbench for each stage, where the operator is needed at every step. The other covers dashboard applications: software built from widgets linked to different data sources. Both open from one internal hub.
The hub's index of kits; both are version 1.0 documents dated June 2024.
02
Between the standards and ODSU
A kit is a best practice. It sits under Roche's mandatory UX standards and implementation guides and turns them into interaction rules for one class of product. ODSU, the design system, supplies the parts: colour tokens, type, icons, side sheets and empty-state illustrations. A research playbook comes before the kit, and ODSU dashboard patterns follow it.
The kits' film lists five promises, from Roche UX standards to 2× design and development speed.
03
A designer's flow
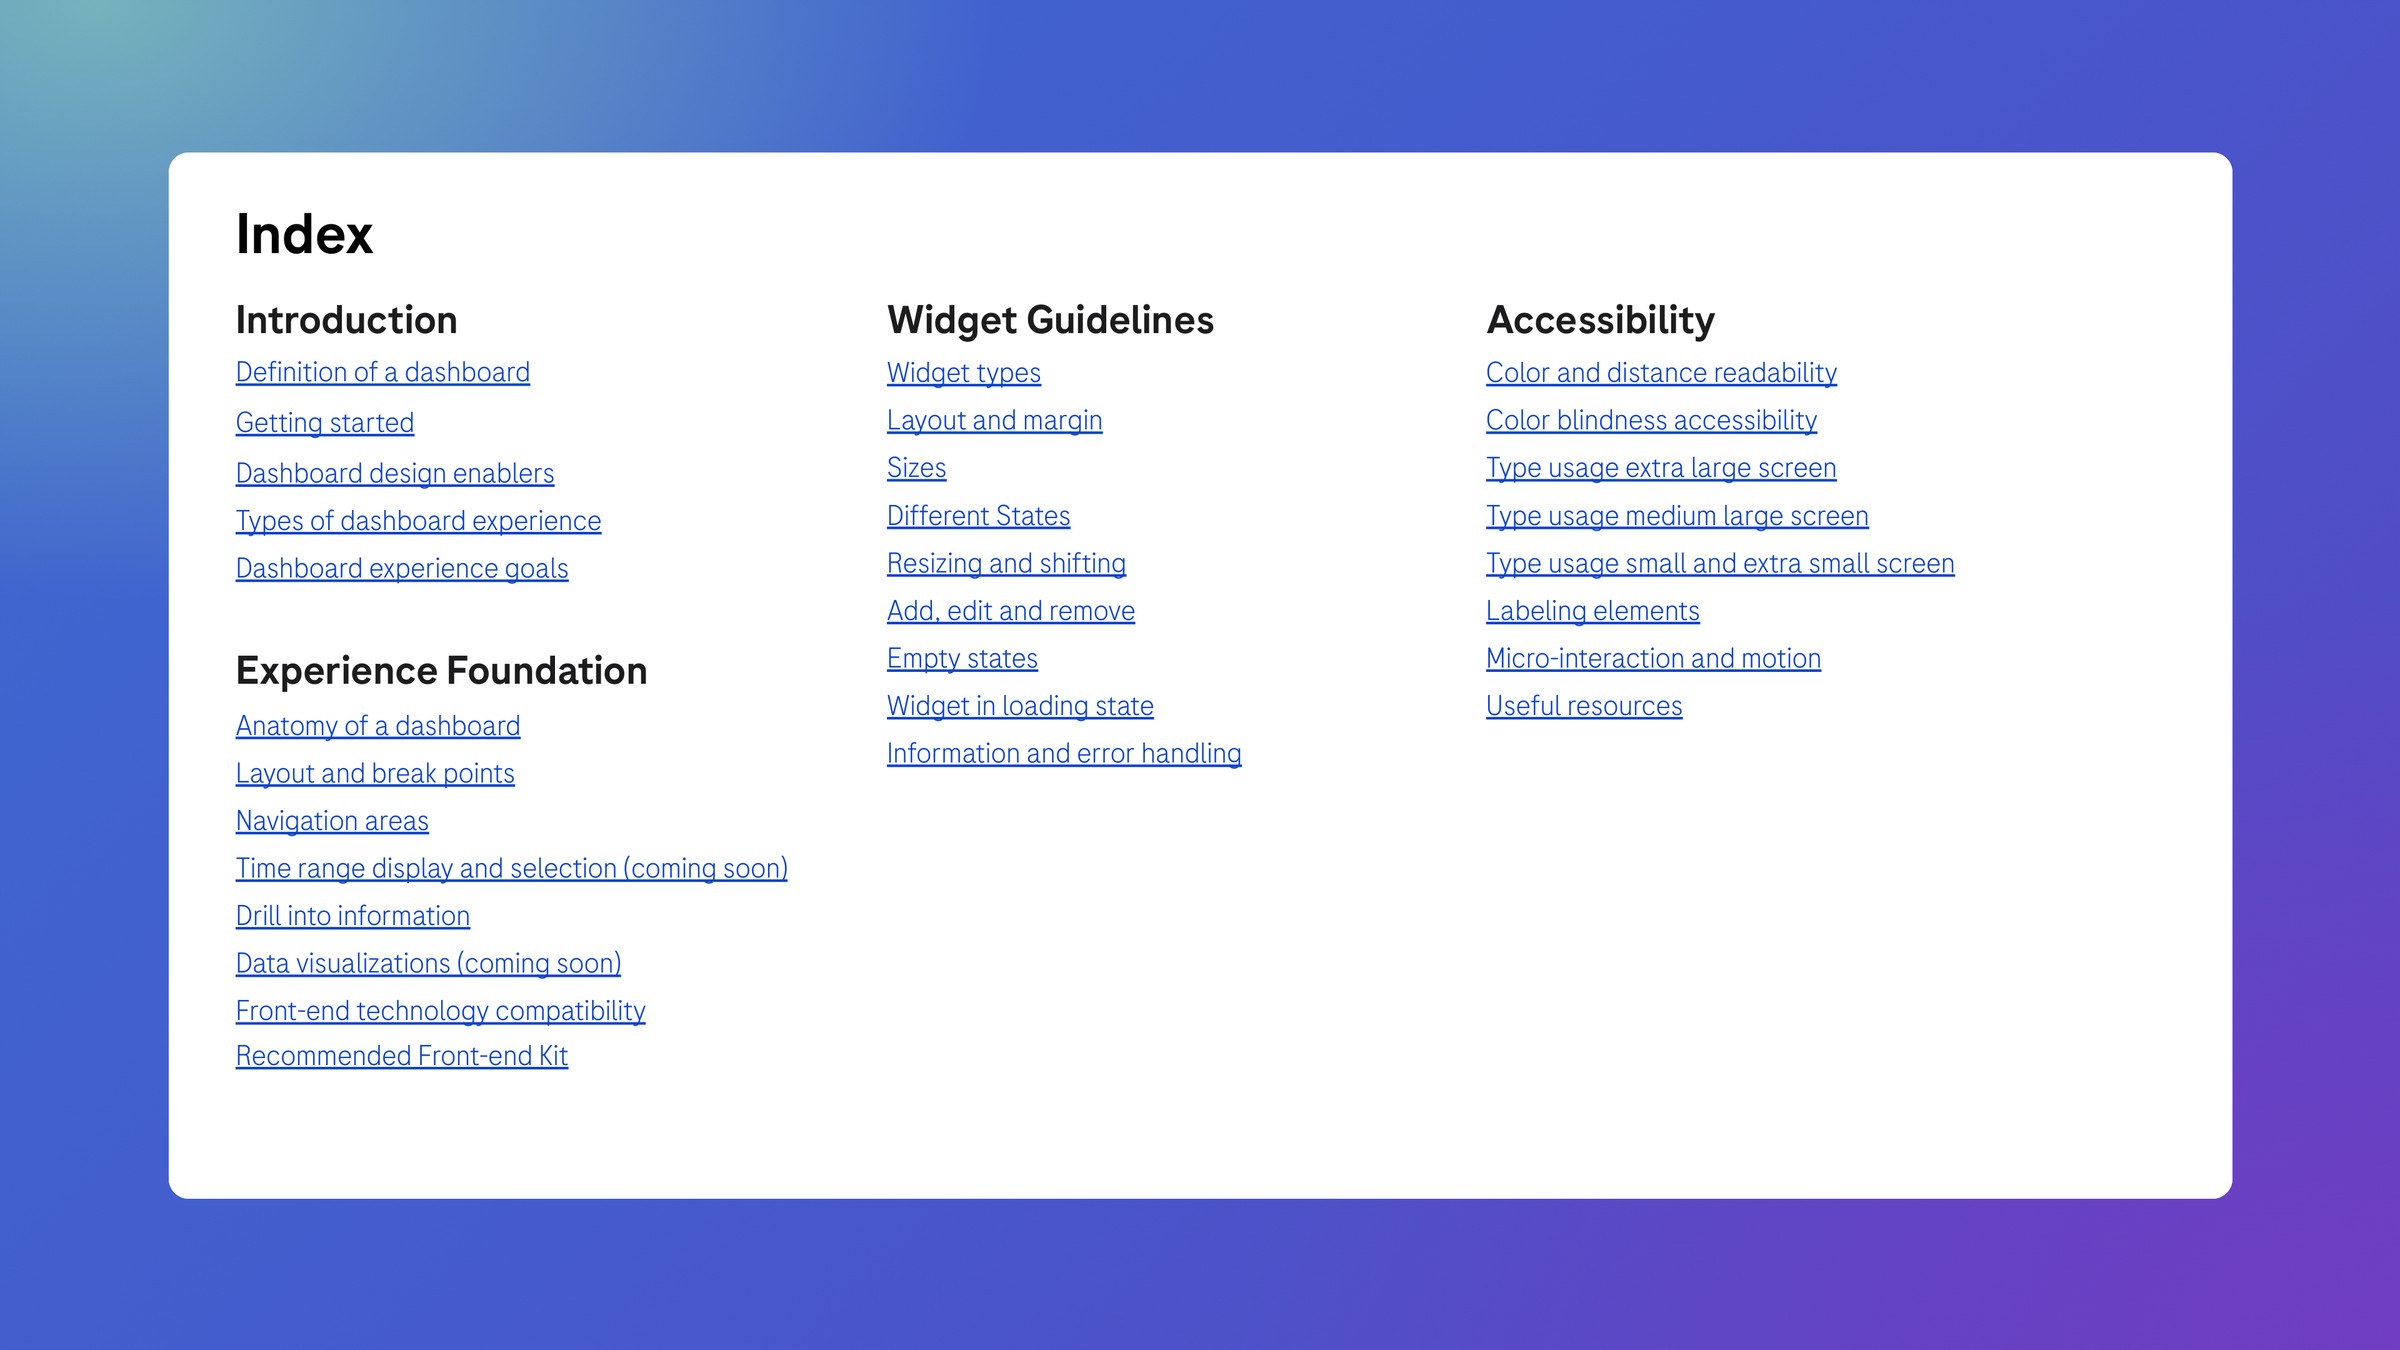
A designer starts in Discover and Define, with the research playbook. In Design and Test, they aim for the kit's six experience goals, from actionable information first to screens that echo the real instrument. Then they check what their build route can do: custom web components support nearly every pattern, Tableau and Superset fewer.
Three slides from the kit, then its index: four parts, 30 topics.
04
Shell, sections, widgets
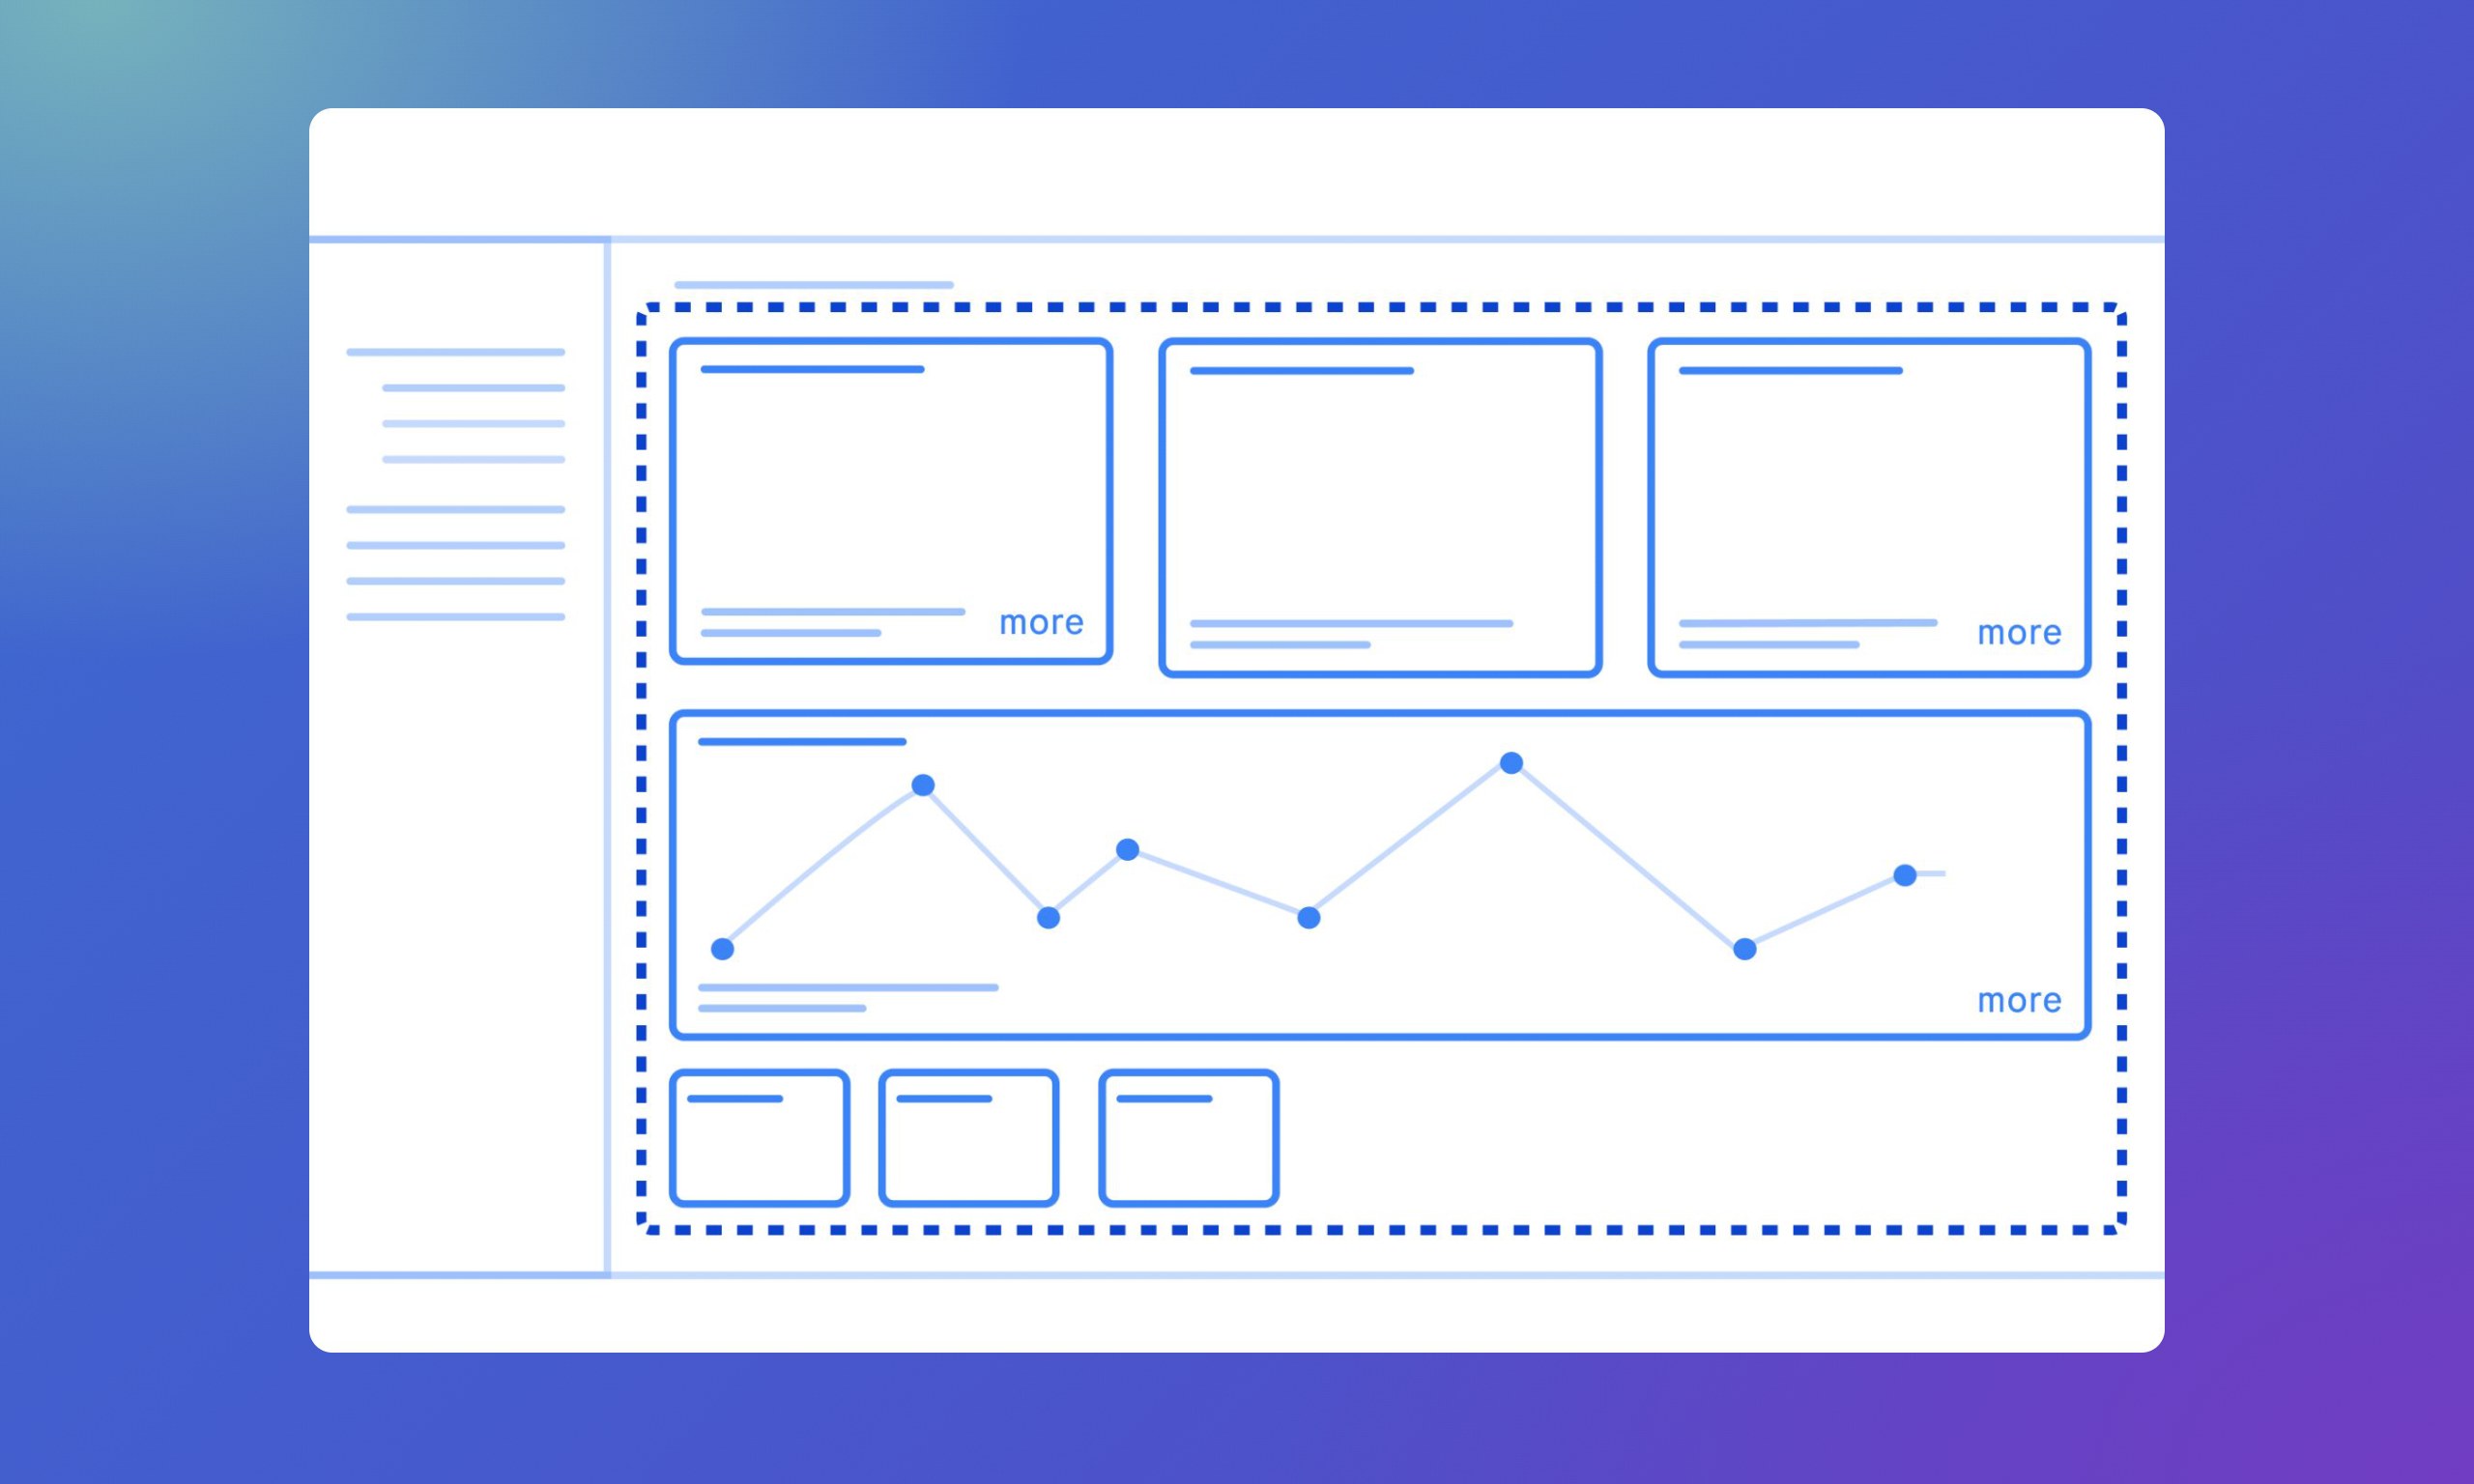
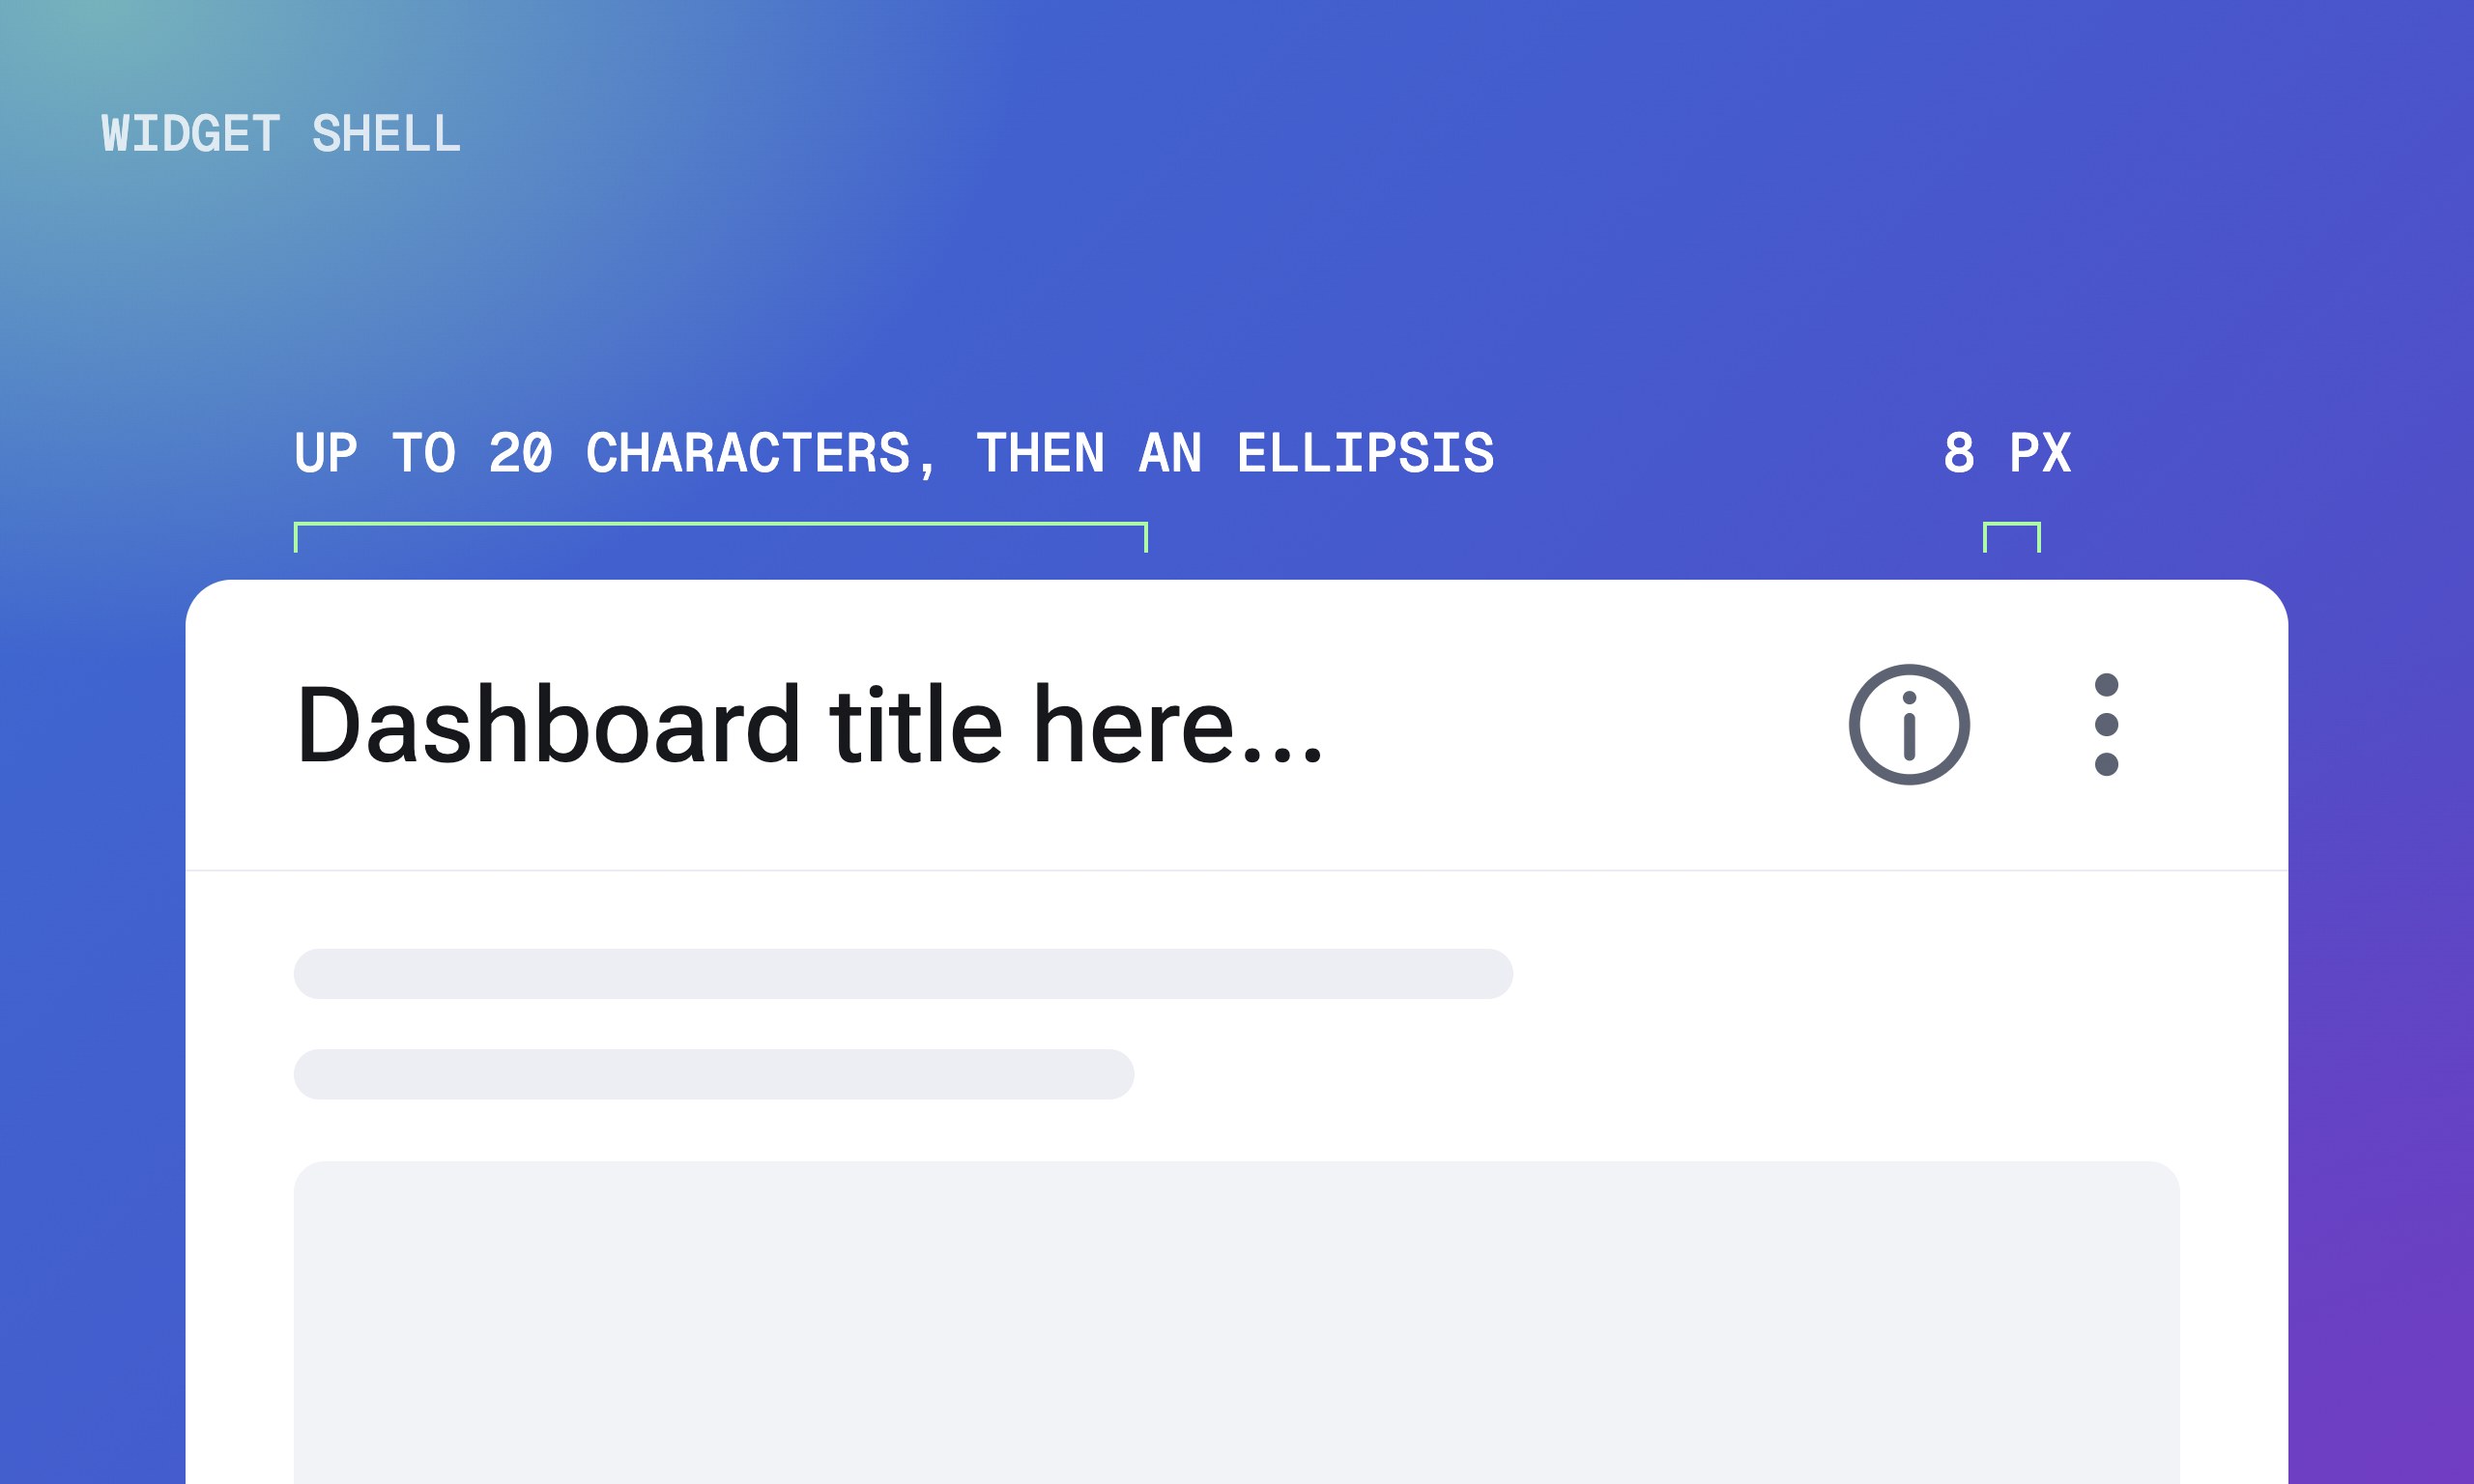
Every dashboard breaks down the same way. A page shell holds the header, footer and side navigation, the content area holds sections, and sections hold widgets. Widget sizes are relative, not pixels: a 1×1 widget covers three columns and three rows of a 12-column grid, where a row is as tall as a column is wide.
A widget has at most four sizes; a 1×1 title fits 20 characters before an ellipsis.
05
From phone to wall screen
The kit sets three screen ranges. Phones and tablets, from 320 to 951 px, keep interaction minimal. Desktops, from 951 to 1920 px, support detailed analysis. Large TV screens above 1920 px are read from more than three metres away, so they favour distance readability over interaction. Each range has its own grid and type scale.
The ranges plotted by viewing distance; the type scaling was tested with users for readability.
06
Every state, designed
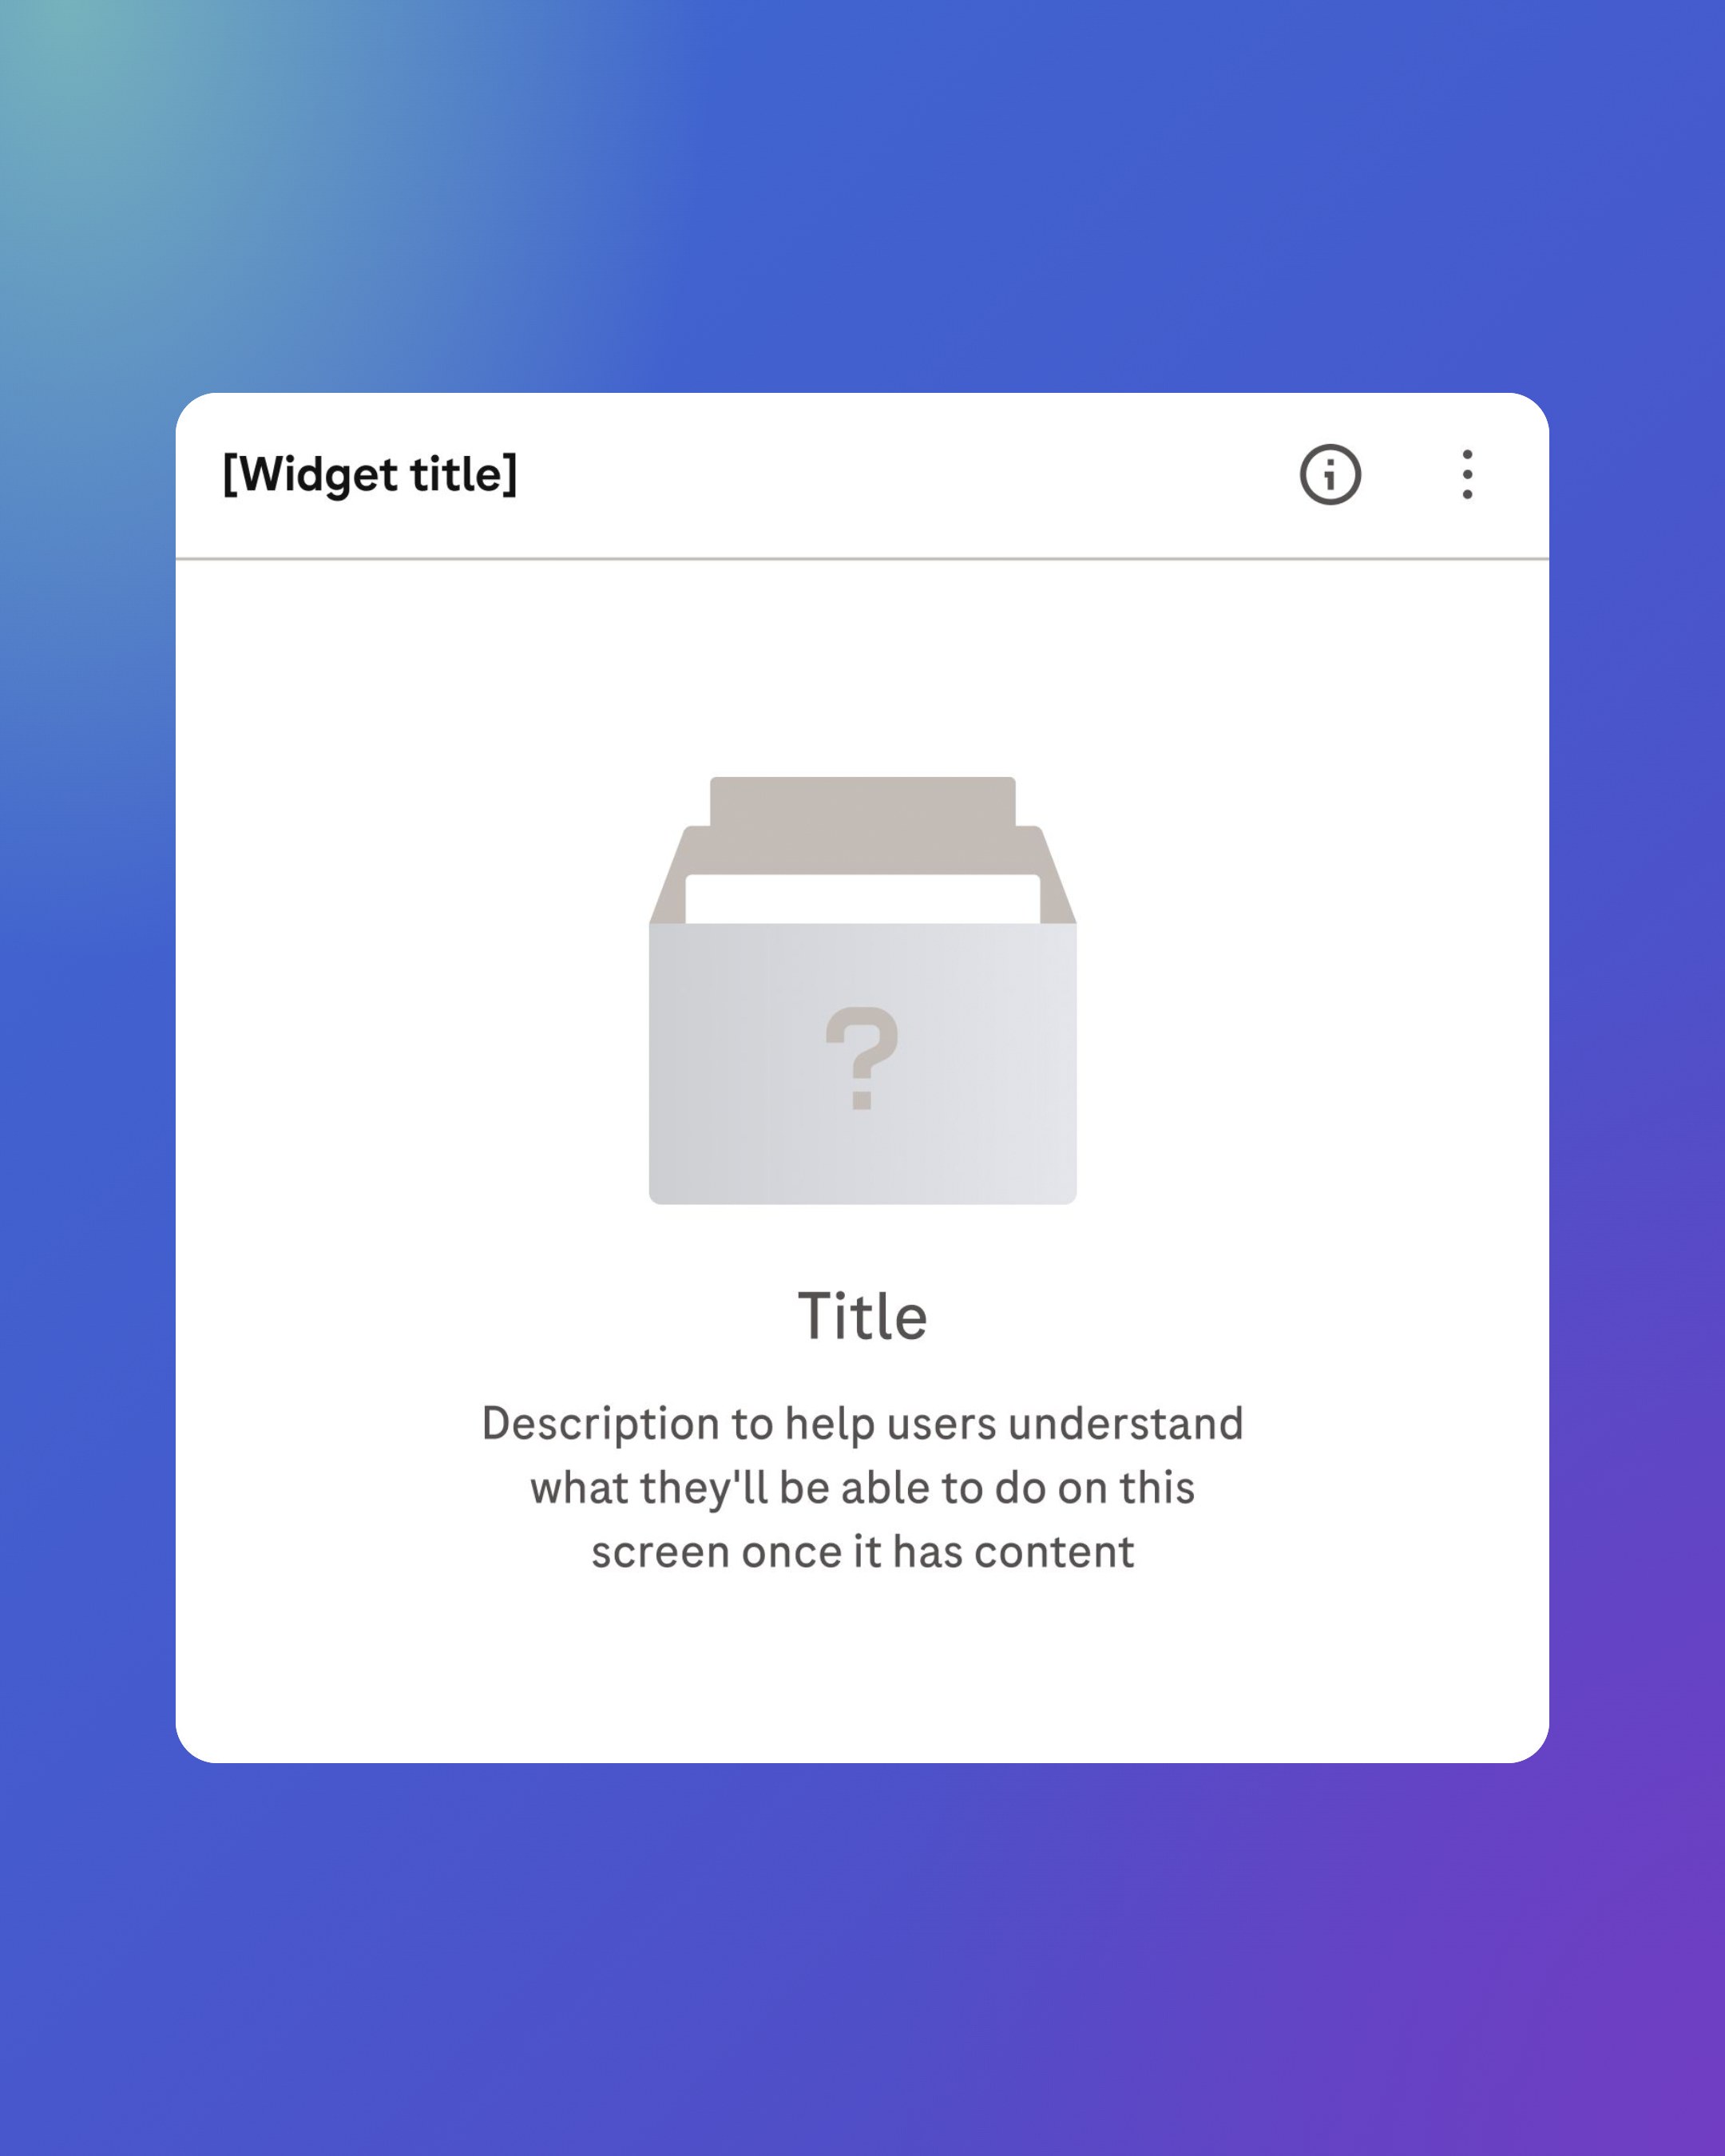
A widget's default states are hovered, focused and disabled. Its customisation states are dragged and resized, in steps that snap to the grid. When there is nothing to show, an empty state replaces the layout, explains why and offers a way forward. While data loads, a skeleton holds the widget's shape.
Five widget states, and an empty state drawn with ODSU's empty-state illustrations.
07
Alert, where, why, action
Drill-down follows one chain, taken from the dashboard design playbook. A KPI must be quantifiable, and when it goes off track the alert pairs colour with an icon or a label. One dimension per KPI, starting with "By", shows where. A side sheet shows why and what to do, and pushes related page content inward instead of covering it.
The four-step chain. Status colours follow red, amber and green ratings and never work alone.
In motion
Outcomes
3screen ranges, from phones to wall screens
>3 mreading distance for the large-screen range
12grid columns behind every widget size
Released the dashboard kit in June 2024, one document every designer at Roche works from
Joined the kit for manually operated systems on one internal hub
Checked every pattern against custom web components, Tableau and Superset
Tested the type scaling with users for distance readability
Showcased both kits in an 87-second film
What I took away
Design for distance, not devices. The ranges follow how far away people read the screen, so a wall display gets its own grid and type scale.
Ship the structure first. Version 1.0 settled shell, sections and widgets, and marked time ranges, data visualisation, labelling and motion as coming soon.
Never let colour work alone. Every status colour comes with a label or an icon, so a colour-blind user reads the same alert.