04 / 19 · Is the culture shift taking hold?

Culture Sense

Culture Sense shows Novartis executives whether the new culture is taking hold and how it links to performance. I led the UX strategy for about 12 months, turning an analytics proof of concept into guided stories.

Role
Lead UX Strategist
Client
Novartis
Industry
Healthcare & life sciences
Year
2020–2021
Work
UX strategy, Data storytelling, User research

A Novartis executive has a few minutes between meetings and one question: is the new culture taking hold? The company had set out to change around four pillars, Inspired, Curious, Unbossed and Integrity, and wanted to know whether the shift moved business performance.

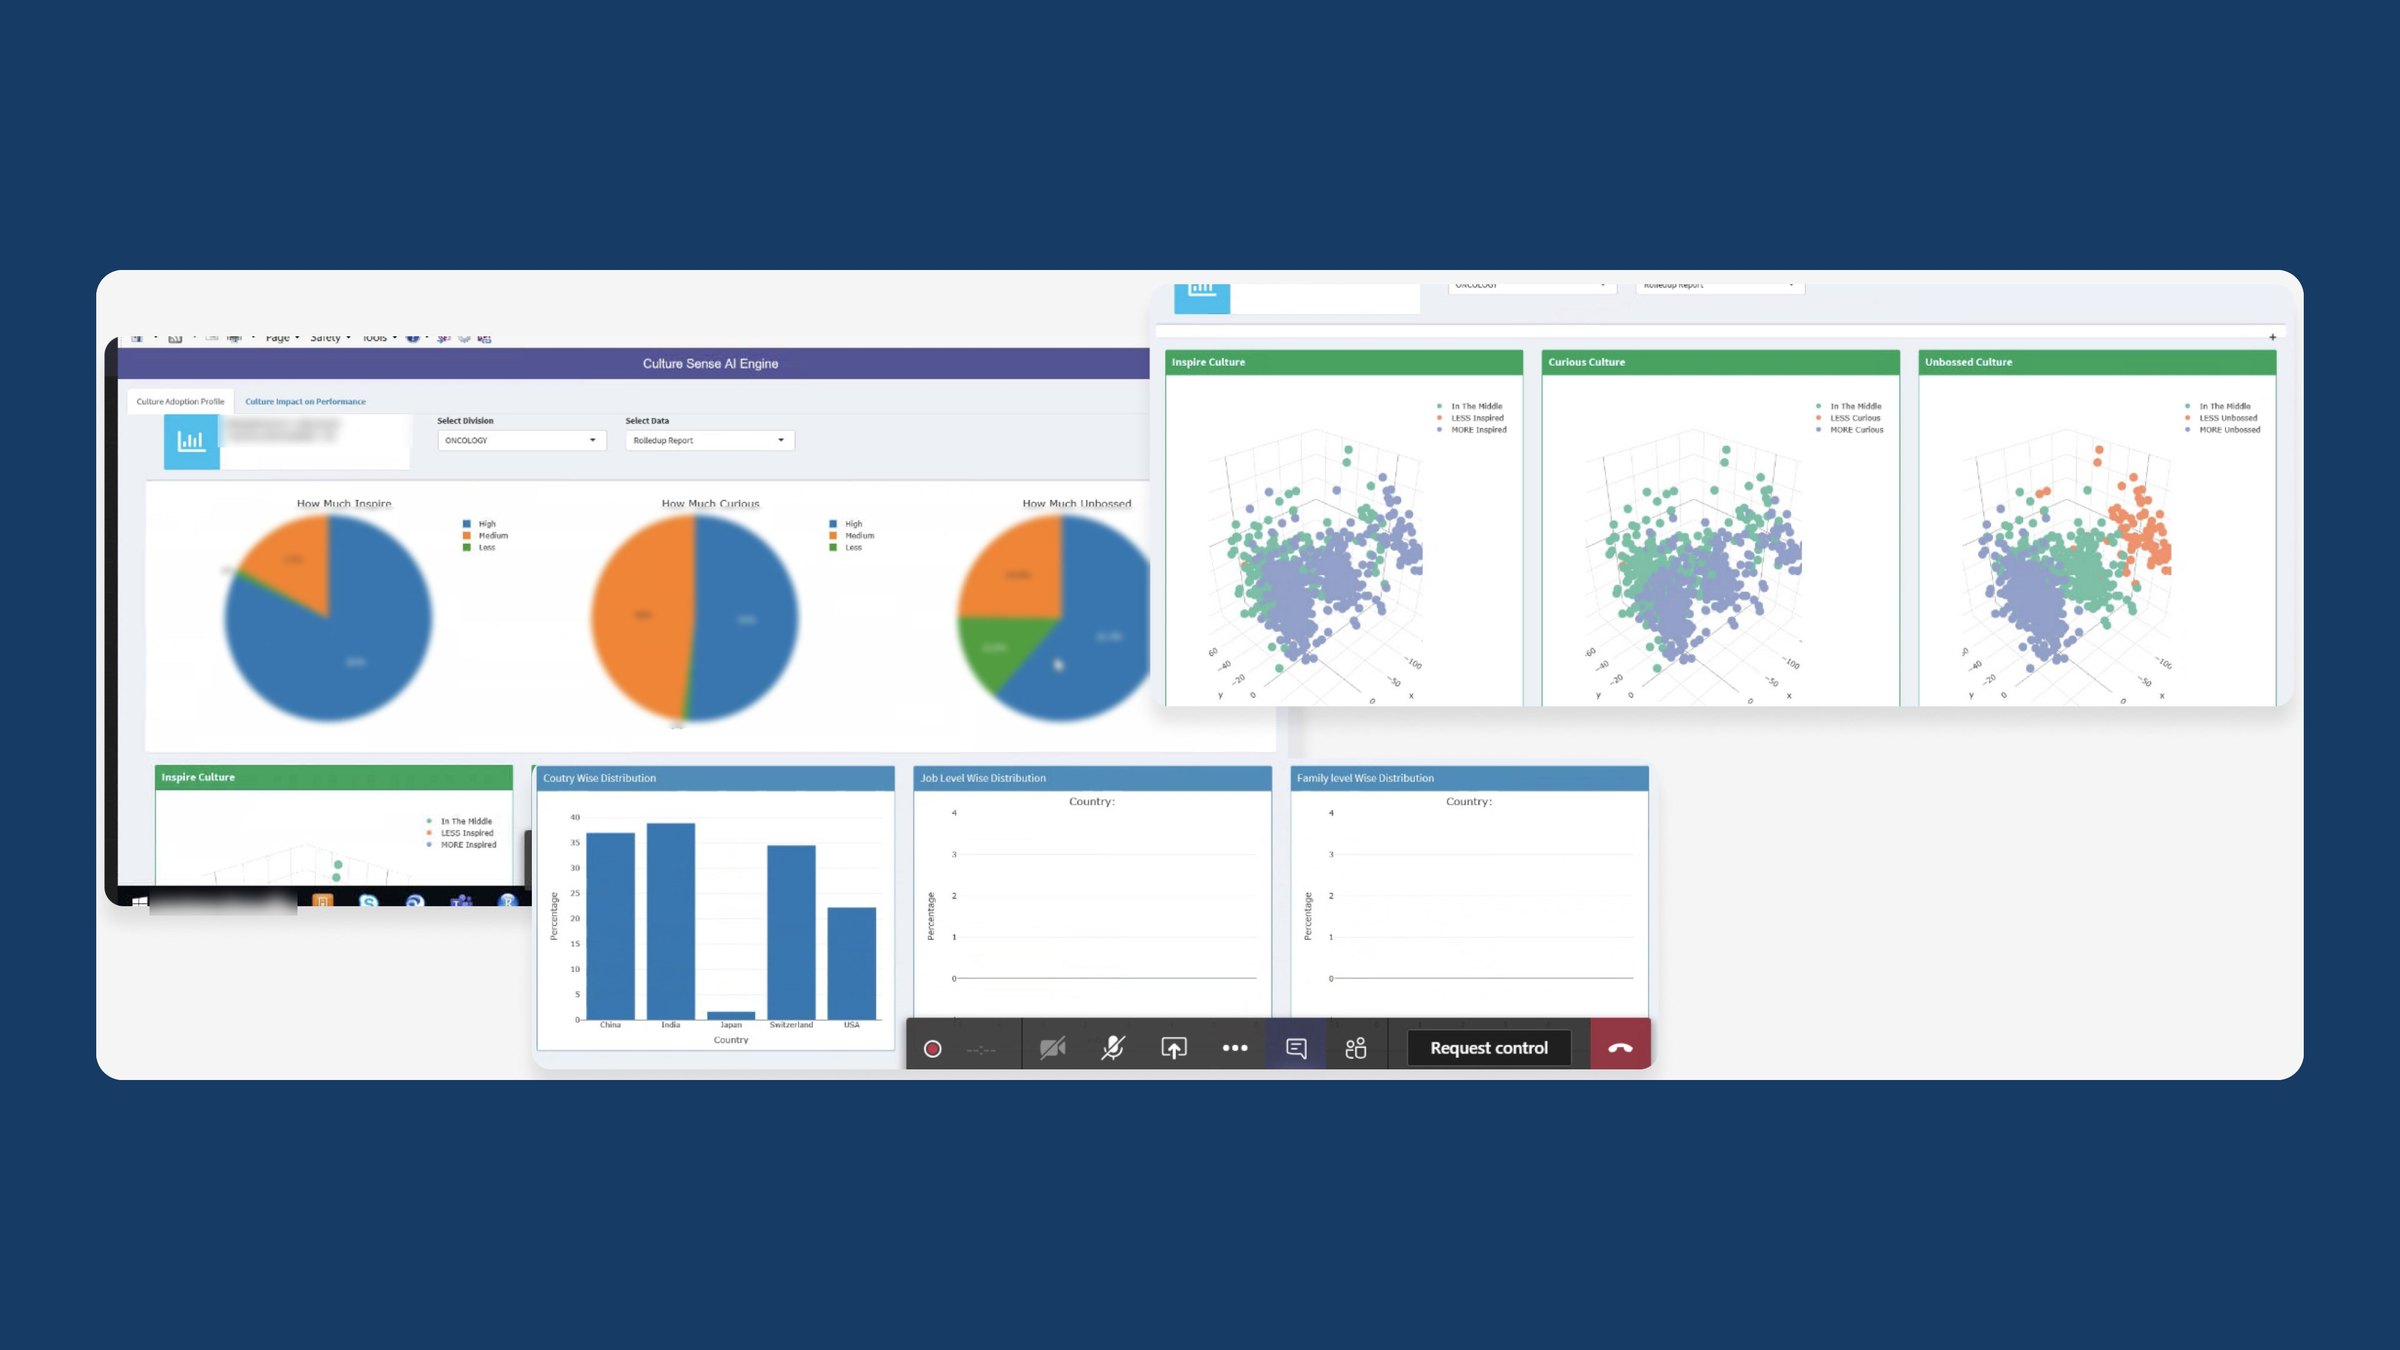
A data science team had already built an AI engine that pulled culture data from several sources into a proof of concept. It spoke the language of analysts: pie charts, 3D scatter plots and country bar charts. Leaders told us plainly that a single score explained nothing, and a wall of data left them unsure where to look.

What would it take for a time-pressed executive to open the tool, grasp where culture stands, and leave with a question worth acting on?

We rebuilt the experience around guided stories rather than raw charts. Culture Sense opens with a short tour. Then comes the Culture Adoption Index: a global map, the four pillars at a glance and a trend line against Novartis and industry averages. Drilldowns cover job level, job family and span of control. Every view sets the score beside a comparison over time or a benchmark. The product sits on Novartis enterprise components, so it feels native beside the tools leaders already use.

My role

Lead UX Strategist. Led the UX strategy over about 12 months, from discovery interviews with senior leaders to 20 usability test sessions. Moved the product from an analytics proof of concept to guided stories, and designed the Culture Adoption Index on Novartis enterprise components.
What made it hard

  • Executive attention

    Leaders give the tool minutes, not hours. Each screen had to make one point fast.

  • From analytics to narrative

    The AI proof of concept had set expectations for dense charts. A simpler story had to prove it would carry more weight.

  • Trust in the numbers

    Culture data is sensitive and easy to misread across countries. Leaders needed to see how a score was built before they would act on it.

  • Fitting the enterprise

    The tool had to sit alongside existing Novartis apps and follow the same design patterns.

Questions we asked

  1. How do senior leaders actually consume insight, on which devices, and in how much time?
  2. Which comparison makes a culture score meaningful: last quarter, another region, or the industry?
  3. How much explanation does a leader need before trusting a number?
  4. Can we guide people to the important finding without hiding the detail behind it?
01

Where we started

The Culture Sense AI Engine already combined data from multiple sources. It proved the data existed, but its pie charts and 3D scatter plots were built for analysts. Discovery interviews with leaders mapped how they consume insight, which devices they use, and how little time they have.

Where we started

The data-science proof of concept, captured from a screen share.

02

From dashboard to story

We set the traditional KPI dashboard beside a storytelling layout to make the choice visible to stakeholders. The story version leads with a map and four pillar bars, adds a trend line against Novartis and industry averages, and ends with cards that invite the next question.

From dashboard to story

The storytelling dashboard reads top to bottom: map, pillars, trend, then the next question. Data is blurred.

03

What leaders told us

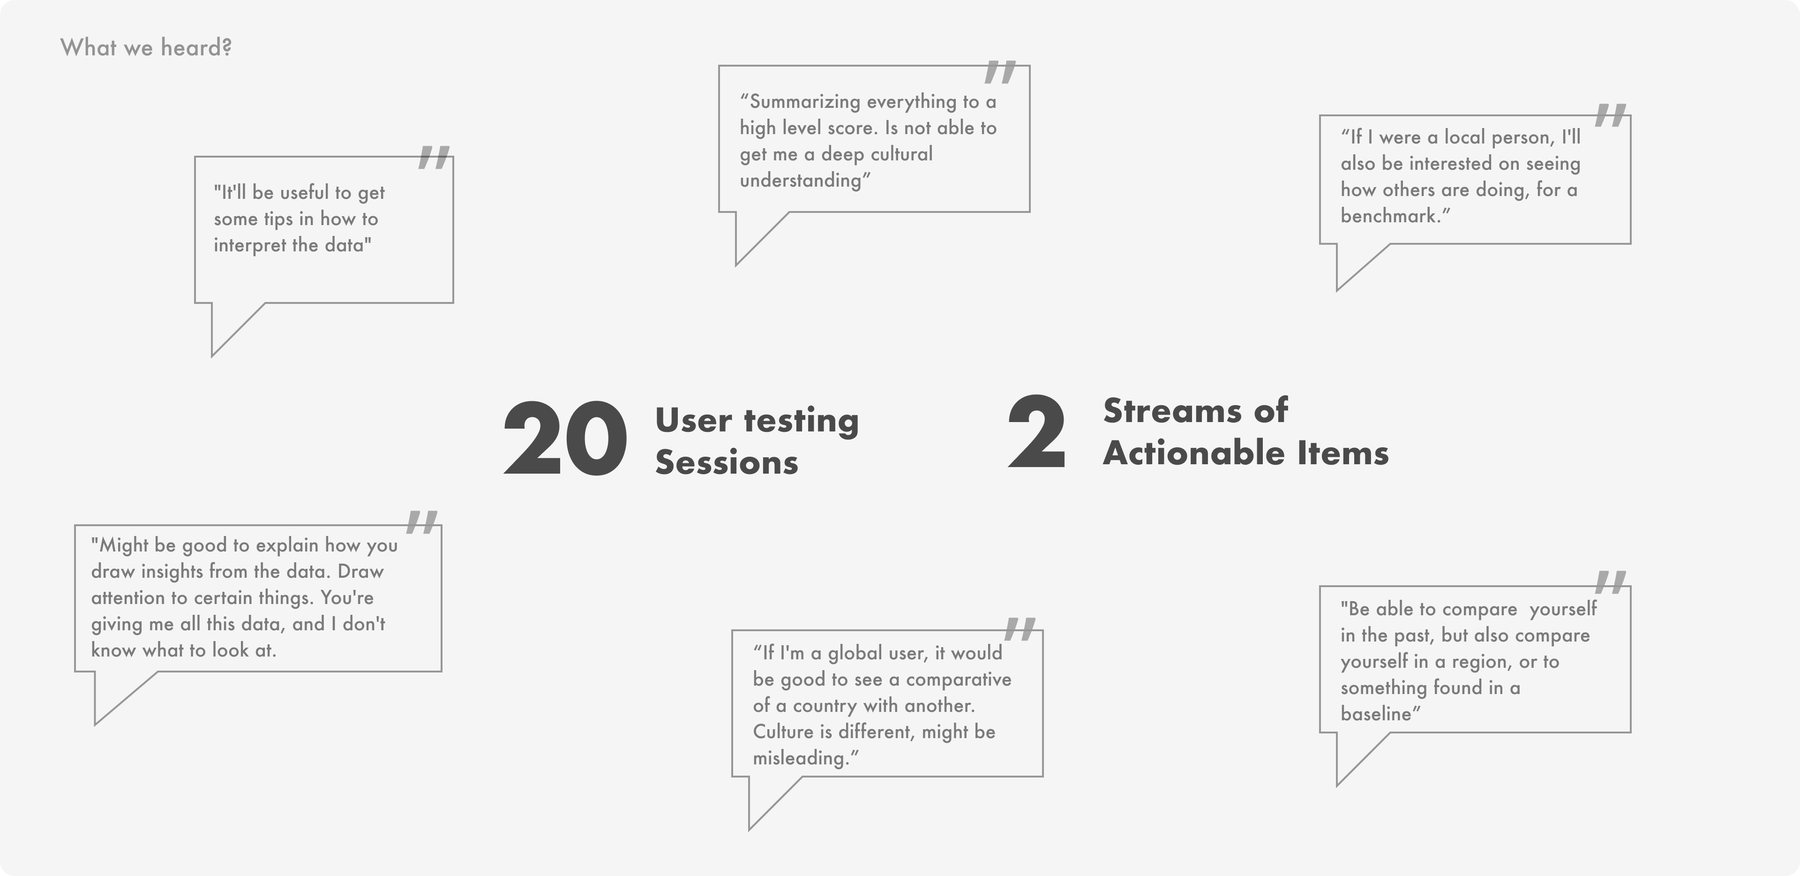
Twenty user testing sessions produced two streams of actions. Leaders asked for tips on reading the data, for benchmarks against other countries and their own past, and for the tool to point out what mattered. One put it simply: "You're giving me all this data, and I don't know what to look at."

What leaders told us
04

The Culture Adoption Index

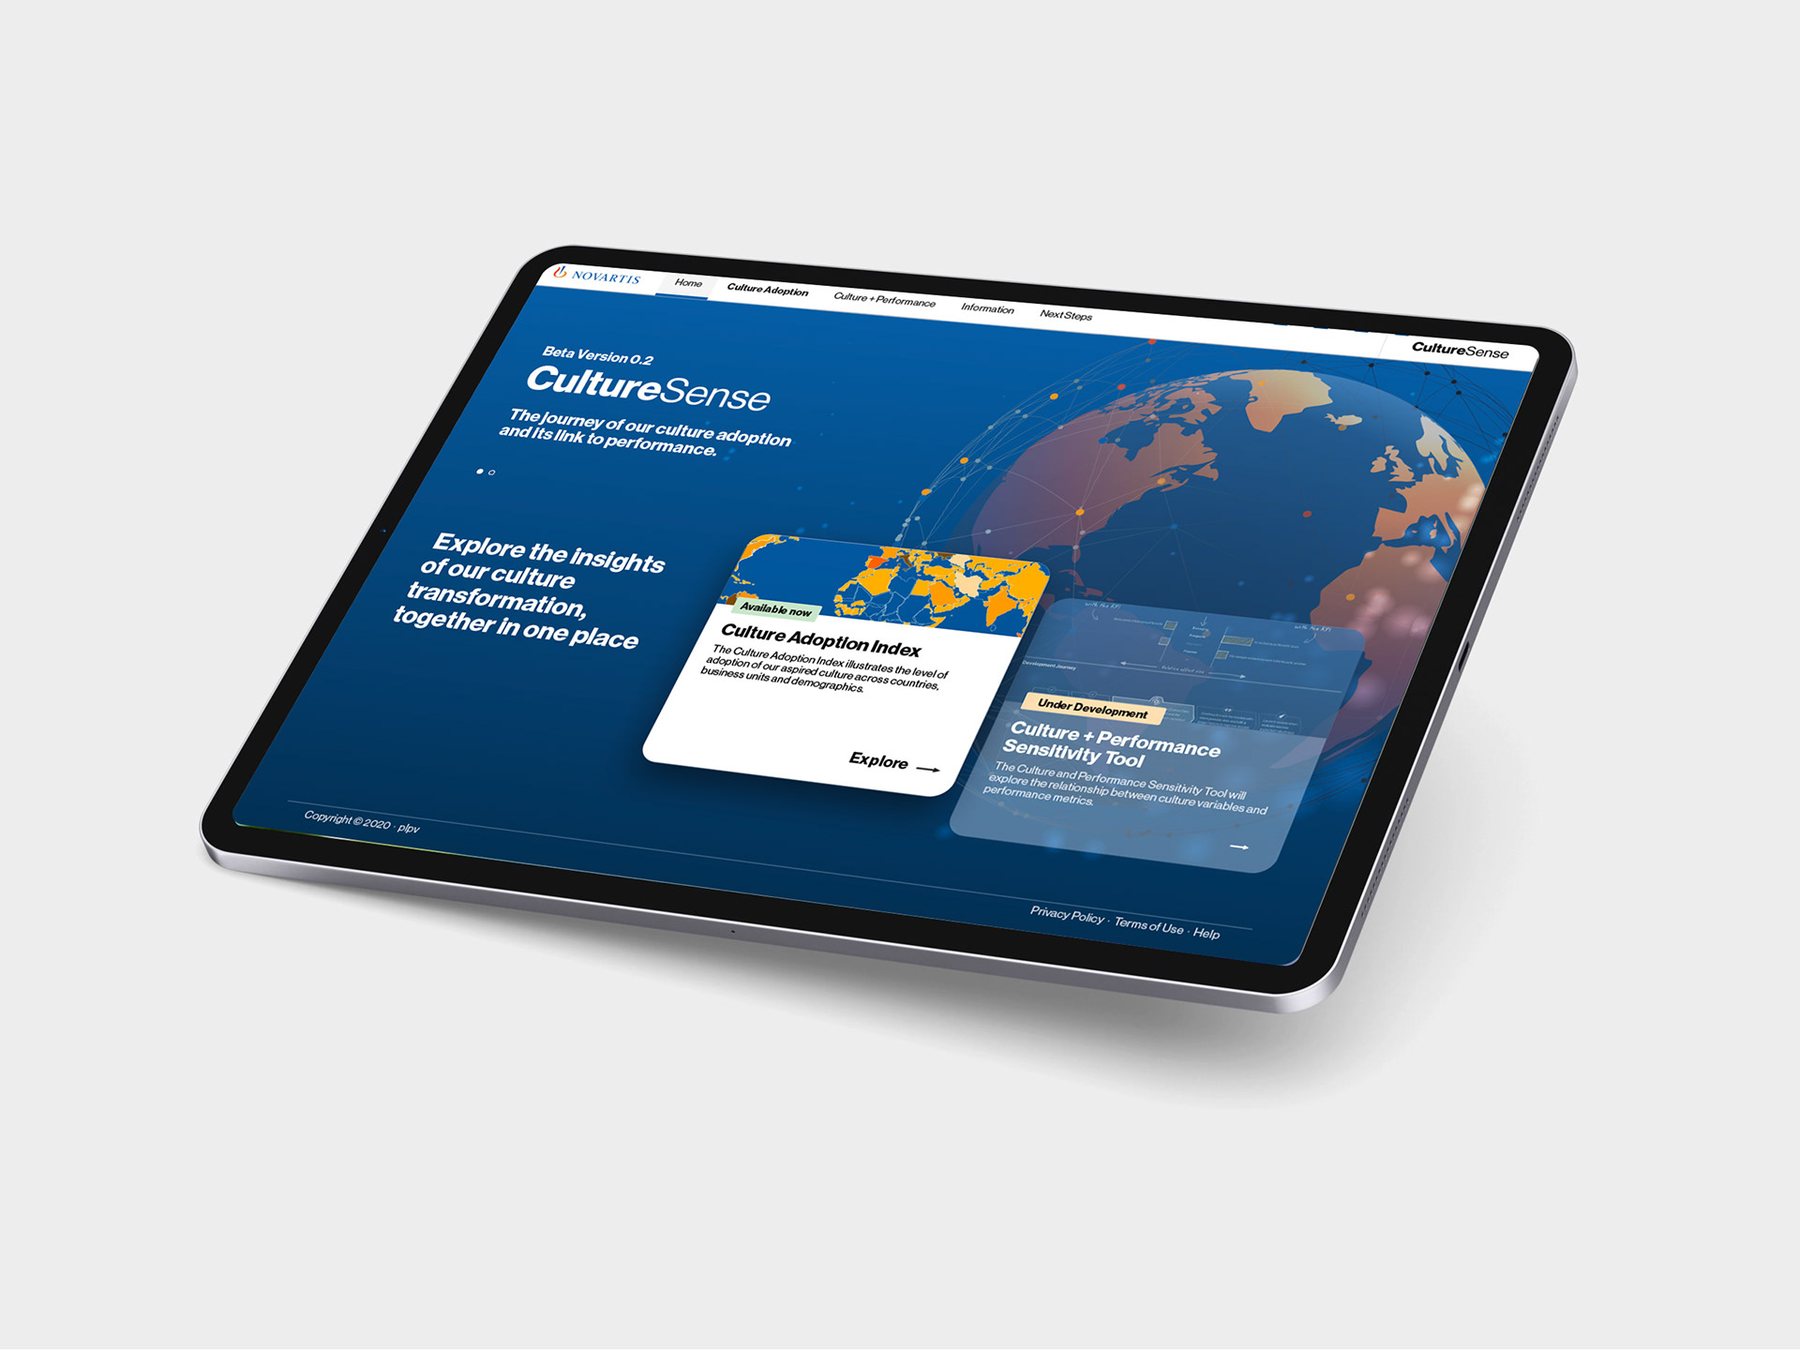
A five-step tour introduces the tool. The home separates what is live, the Culture Adoption Index, from what is coming, the Culture and Performance Sensitivity Tool. Inside the index, leaders move from the global picture to organisational factors such as job level, job family and span of control, always with a comparison beside the score.

Onboarding tour, the index and two drilldowns, each with a comparison beside the score. Scores are blurred.

05

Native to the enterprise

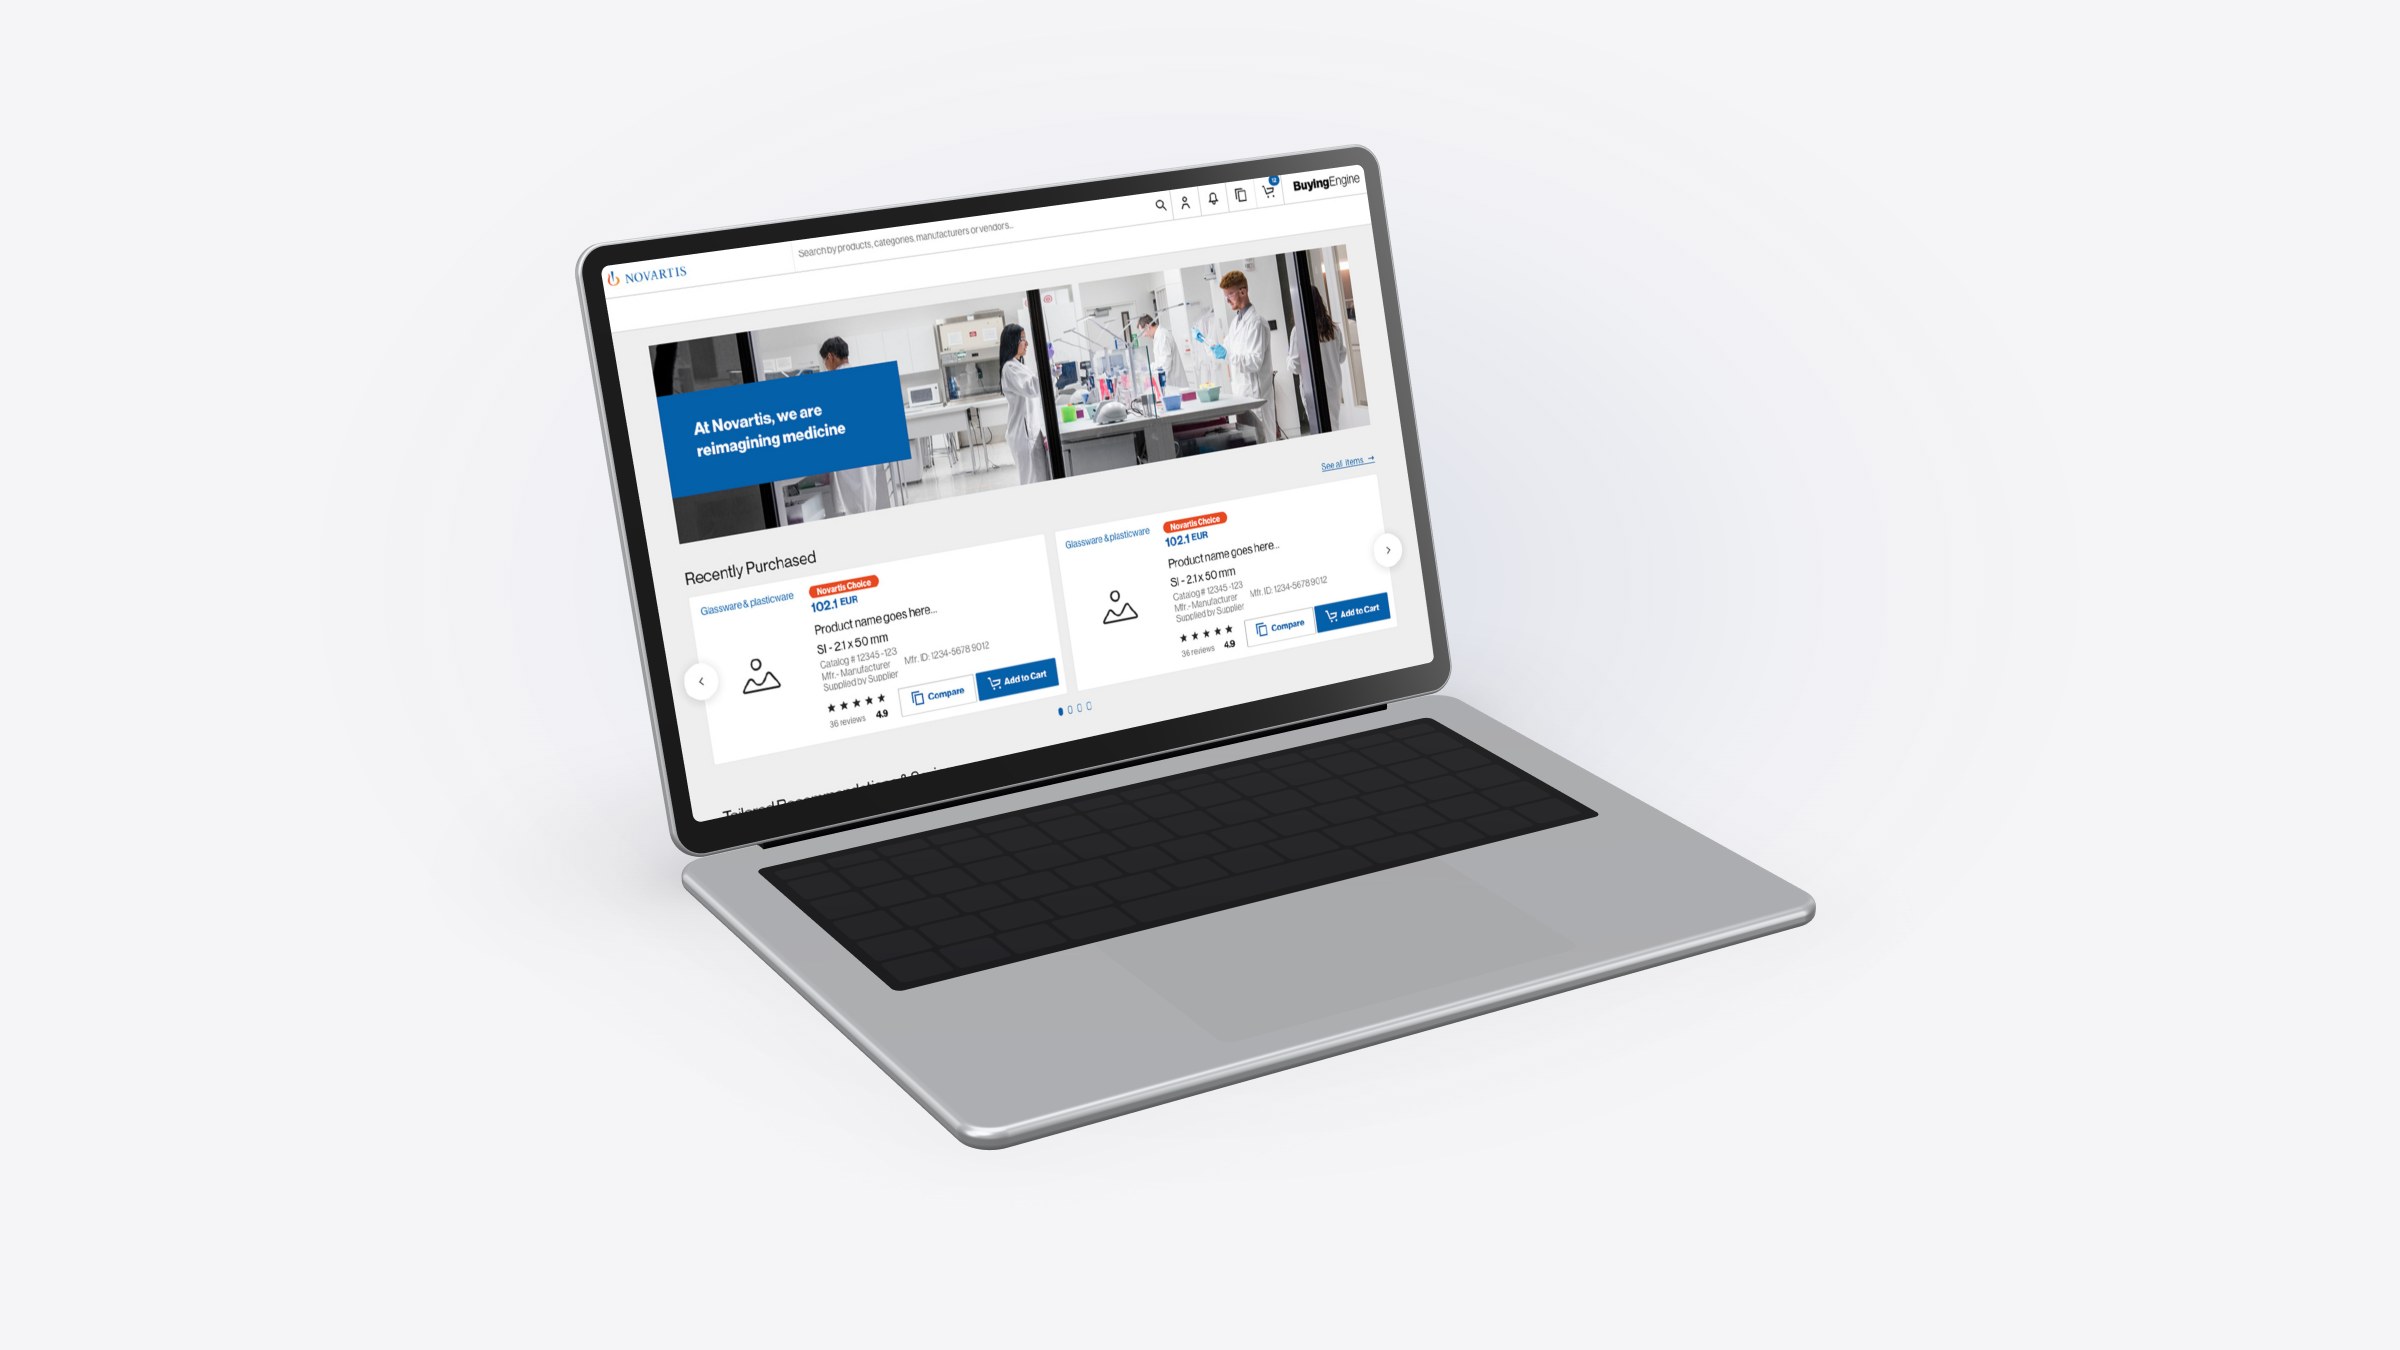
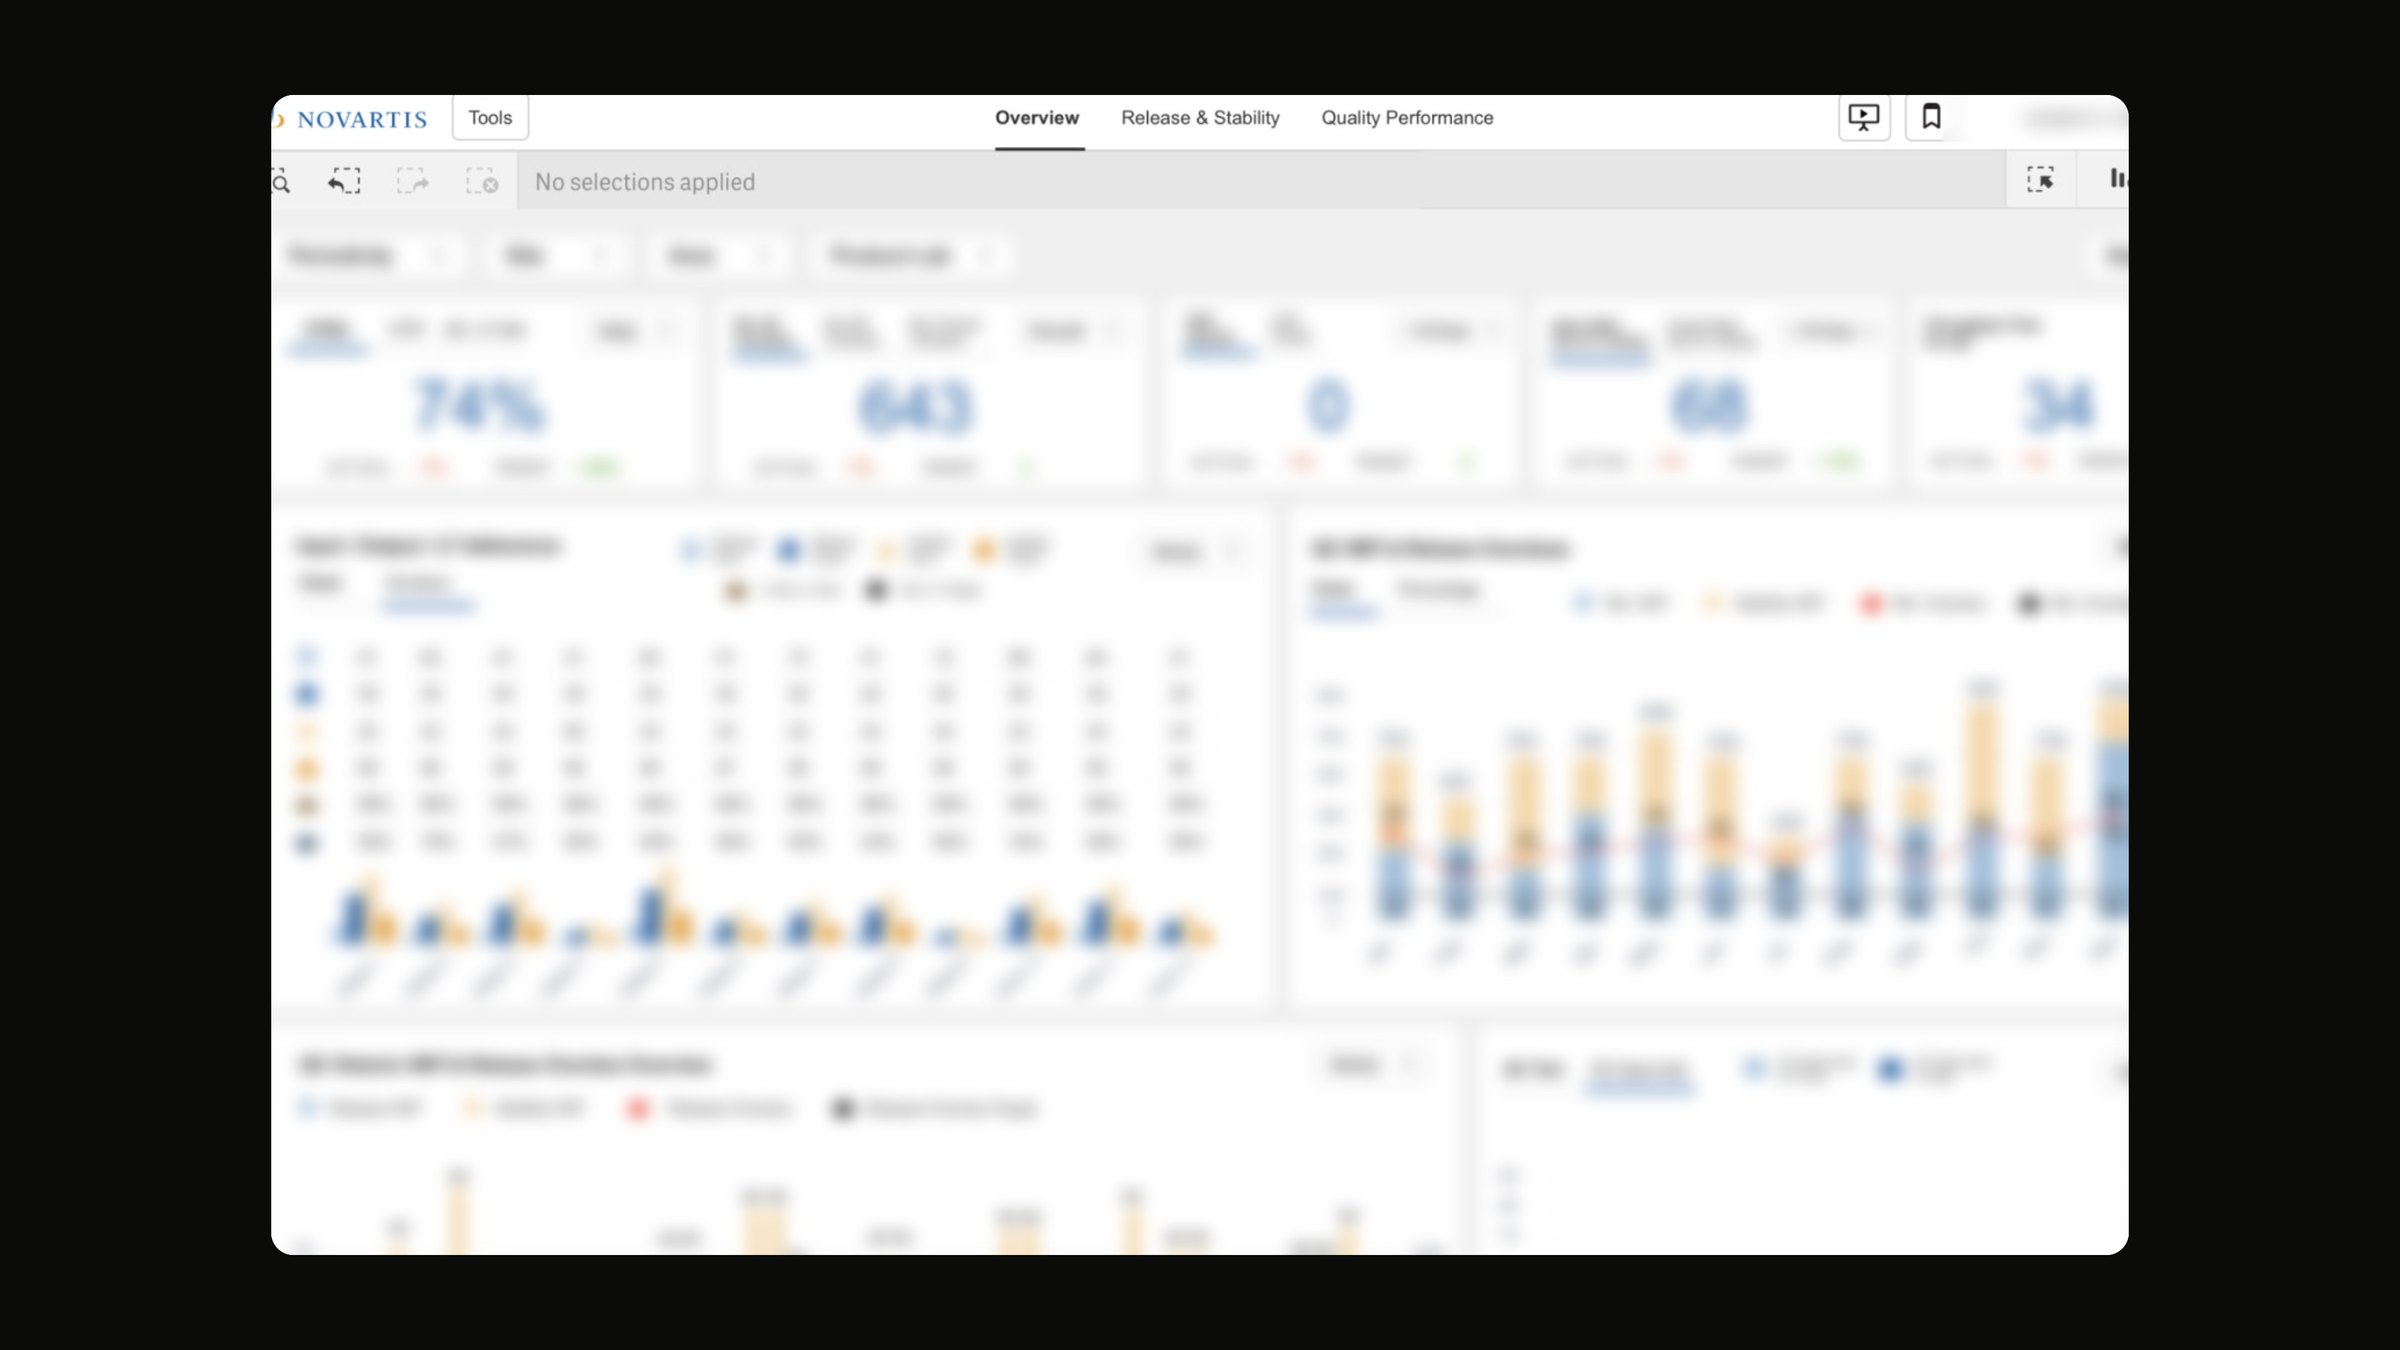
Built on Novartis enterprise (WADS) components, Culture Sense matches the patterns leaders already know, which cut delivery time and kept the beta consistent from version 0.2 to 0.3.

Native to the enterprise

In motion

Outcomes

  • 20user testing sessions
  • ~12months of UX strategy
  • 4culture pillars made readable
  • Integrated with the Novartis enterprise suite on shared WADS components
  • Navigation built for senior leaders, with stories that prompt the next question
  • Reported higher executive engagement, put down to clearer views and easier use

What I took away

  • Give executives a point of view. Comparison and narrative did more for comprehension than any extra chart.
  • Show how the number is made. That earned more trust than polishing the number itself.
  • Reuse the enterprise system. It bought speed and made a new tool feel familiar on day one.
Lead UX Strategist
Preetham Lawrence
Have a hard problem worth solving?

Let's solve it together.

preetham.lawrence@icloud.com
+41 76 740 46 30Phone
LinkedIn↗ Writing on Medium↗

Design leader based in Zürich, Switzerland. Open to leadership roles and selected collaborations.

© 2026 Preetham LawrenceIndex